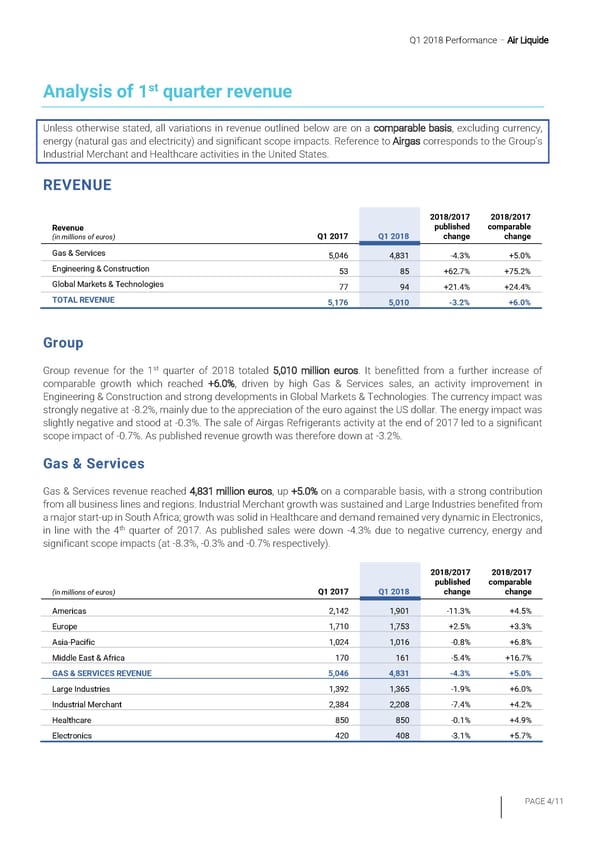
Q1 2018 Performance – Air Liquide st Analysis of 1 quarter revenue Unless otherwise stated, all variations in revenue outlined below are on a comparable basis, excluding currency, energy (natural gas and electricity) and significant scope impacts. Reference to Airgas corresponds to the Group’s Industrial Merchant and Healthcare activities in the United States. REVENUE 2018/2017 2018/2017 Revenue published comparable (in millions of euros) Q1 2017 Q1 2018 change change Gas & Services 5,046 4,831 -4.3% +5.0% Engineering & Construction 53 85 +62.7% +75.2% Global Markets & Technologies 77 94 +21.4% +24.4% TOTAL REVENUE 5,176 5,010 -3.2% +6.0% Group st Group revenue for the 1 quarter of 2018 totaled 5,010 million euros. It benefitted from a further increase of comparable growth which reached +6.0%, driven by high Gas & Services sales, an activity improvement in Engineering & Construction and strong developments in Global Markets & Technologies. The currency impact was strongly negative at -8.2%, mainly due to the appreciation of the euro against the US dollar. The energy impact was slightly negative and stood at -0.3%. The sale of Airgas Refrigerants activity at the end of 2017 led to a significant scope impact of -0.7%. As published revenue growth was therefore down at -3.2%. Gas & Services Gas & Services revenue reached 4,831 million euros, up +5.0% on a comparable basis, with a strong contribution from all business lines and regions. Industrial Merchant growth was sustained and Large Industries benefited from a major start-up in South Africa; growth was solid in Healthcare and demand remained very dynamic in Electronics, in line with the 4th quarter of 2017. As published sales were down -4.3% due to negative currency, energy and significant scope impacts (at -8.3%, -0.3% and -0.7% respectively). 2018/2017 2018/2017 published comparable (in millions of euros) Q1 2017 Q1 2018 change change Americas 2,142 1,901 -11.3% +4.5% Europe 1,710 1,753 +2.5% +3.3% Asia-Pacific 1,024 1,016 -0.8% +6.8% Middle East & Africa 170 161 -5.4% +16.7% GAS & SERVICES REVENUE 5,046 4,831 -4.3% +5.0% Large Industries 1,392 1,365 -1.9% +6.0% Industrial Merchant 2,384 2,208 -7.4% +4.2% Healthcare 850 850 -0.1% +4.9% Electronics 420 408 -3.1% +5.7% PAGE 4/11
 Q1 2018 Revenue Page 6 Page 8