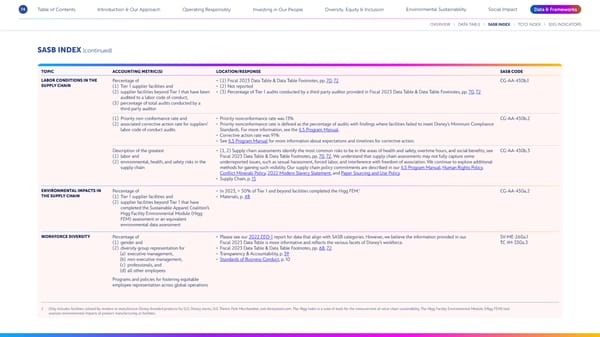
74 Table of Contents Introduction & Our Approach Operating Responsibly Investing in Our People Diversity, Equity & Inclusion Environmental Sustainability Social Impact Data & Frameworks OVERVIEW DATA TABLE SASB INDEX TCFD INDEX SDG INDICATORS SASB INDEX (continued) TOPIC ACCOUNTING METRIC(S) LOCATION/RESPONSE SASB CODE LABOR CONDITIONS IN THE Percentage of • (1) Fiscal 2023 Data Table & Data Table Footnotes, pp. 70, 72 CG-AA-430b.1 SUPPLY CHAIN (1) Tier 1 supplier facilities and • (2) Not reported (2) supplier facilities beyond Tier 1 that have been • (3) Percentage of Tier 1 audits conducted by a third-party auditor provided in Fiscal 2023 Data Table & Data Table Footnotes, pp. 70, 72 audited to a labor code of conduct, (3) percentage of total audits conducted by a third-party auditor (1) Priority non-conformance rate and • Priority nonconformance rate was 13% CG-AA-430b.2 (2) associated corrective action rate for suppliers’ • Priority nonconformance rate is de昀椀ned as the percentage of audits with 昀椀ndings where facilities failed to meet Disney’s Minimum Compliance labor code of conduct audits Standards. For more information, see the ILS Program Manual. • Corrective action rate was 91% • See ILS Program Manual for more information about expectations and timelines for corrective action. Description of the greatest • (1, 2) Supply chain assessments identify the most common risks to be in the areas of health and safety, overtime hours, and social bene昀椀ts; see CG-AA-430b.3 (1) labor and Fiscal 2023 Data Table & Data Table Footnotes, pp. 70, 72. We understand that supply chain assessments may not fully capture some (2) environmental, health, and safety risks in the underreported issues, such as sexual harassment, forced labor, and interference with freedom of association. We continue to explore additional supply chain methods for gaining such visibility. Our supply chain policy commitments are described in our ILS Program Manual, Human Rights Policy, Con昀氀ict Minerals Policy, 2022 Modern Slavery Statement, and Paper Sourcing and Use Policy. • Supply Chain, p. 15 ENVIRONMENTAL IMPACTS IN † Percentage of • In 2023, > 50% of Tier 1 and beyond facilities completed the Higg FEM. CG-AA-430a.2 THE SUPPLY CHAIN (1) Tier 1 supplier facilities and • Materials, p. 48 (2) supplier facilities beyond Tier 1 that have completed the Sustainable Apparel Coalition’s Higg Facility Environmental Module (Higg FEM) assessment or an equivalent environmental data assessment WORKFORCE DIVERSITY Percentage of • Please see our 2022 EEO-1 report for data that align with SASB categories. However, we believe the information provided in our SV-ME-260a.1 (1) gender and Fiscal 2023 Data Table is more informative and re昀氀ects the various facets of Disney’s workforce. TC-IM-330a.3 (2) diversity group representation for • Fiscal 2023 Data Table & Data Table Footnotes, pp. 68, 72 (a) executive management, • Transparency & Accountability, p. 39 (b) non-executive management, • Standards of Business Conduct, p. 10 (c) professionals, and (d) all other employees Programs and policies for fostering equitable employee representation across global operations † Only includes facilities utilized by vendors to manufacture Disney-branded products for U.S. Disney stores, U.S. Theme Park Merchandise, and disneystore.com. The Higg Index is a suite of tools for the measurement of value chain sustainability. The Higg Facility Environmental Module (Higg FEM) tool assesses environmental impacts of product manufacturing at facilities.
 Disney 2023 Sustainability & Social Impact Report Page 73 Page 75