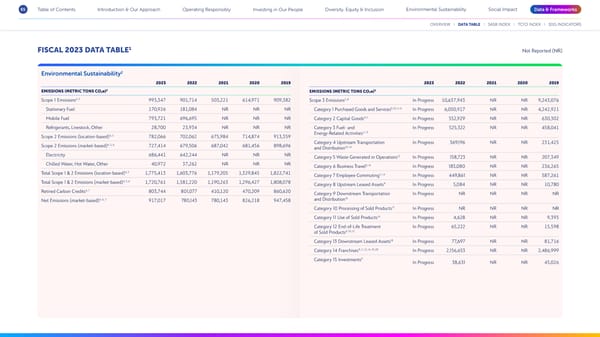
65 Table of Contents Introduction & Our Approach Operating Responsibly Investing in Our People Diversity, Equity & Inclusion Environmental Sustainability Social Impact Data & Frameworks OVERVIEW DATA TABLE SASB INDEX TCFD INDEX SDG INDICATORS FISCAL 2023 DATA TABLE1 Not Reported (NR) 2 Environmental Sustainability 2023 2022 2021 2020 2019 2023 2022 2021 2020 2019 EMISSIONS (METRIC TONS CO e)3 3 2 EMISSIONS (METRIC TONS CO e) 2 4, 5 5, 8 Scope 1 Emissions 993,347 901,714 503,221 614,971 909,382 Scope 3 Emissions In Progress 10,637,943 NR NR 9,243,076 Stationary Fuel 170,926 181,084 NR NR NR 9, 10, 11, 12 Category 1 Purchased Goods and Services In Progress 6,050,917 NR NR 4,242,921 Mobile Fuel 793,721 696,695 NR NR NR Category 2 Capital Goods9, 11 In Progress 552,929 NR NR 630,302 Refrigerants, Livestock, Other 28,700 23,934 NR NR NR Category 3 Fuel- and In Progress 525,322 NR NR 458,041 11, 13 4, 5 Energy-Related Activities Scope 2 Emissions (location-based) 782,066 702,062 675,984 714,874 913,359 4, 5, 6 Category 4 Upstream Transportation In Progress 369,196 NR NR 231,425 Scope 2 Emissions (market-based) 727,414 679,506 687,042 681,456 898,696 10, 14 and Distribution Electricity 686,441 642,244 NR NR NR 15 Category 5 Waste Generated in Operations In Progress 158,723 NR NR 207,349 Chilled Water, Hot Water, Other 40,972 37,262 NR NR NR Category 6 Business Travel9, 14 In Progress 183,080 NR NR 236,265 4, 5 Total Scope 1 & 2 Emissions (location-based) 1,775,413 1,603,776 1,179,205 1,329,845 1,822,741 11, 14 Category 7 Employee Commuting In Progress 449,861 NR NR 587,261 4, 5, 6 Total Scope 1 & 2 Emissions (market-based) 1,720,761 1,581,220 1,190,263 1,296,427 1,808,078 Category 8 Upstream Leased Assets9 In Progress 5,084 NR NR 10,780 Retired Carbon Credits6, 7 803,744 801,077 410,120 470,209 860,620 Category 9 Downstream Transportation In Progress NR NR NR NR 4, 6, 7 16 Net Emissions (market-based) 917,017 780,143 780,143 826,218 947,458 and Distribution Category 10 Processing of Sold Products17 In Progress NR NR NR NR 14 Category 11 Use of Sold Products In Progress 4,628 NR NR 9,393 Category 12 End-of-Life Treatment In Progress 65,222 NR NR 15,598 of Sold Products9, 10, 12 18 Category 13 Downstream Leased Assets In Progress 77,697 NR NR 81,716 9, 11, 12, 14, 19, 20 Category 14 Franchises In Progress 2,156,653 NR NR 2,486,999 Category 15 Investments9 In Progress 38,631 NR NR 45,026
 Disney 2023 Sustainability & Social Impact Report Page 64 Page 66