Internet Trends 2019 - Mary Meeker
INTERACTIVE KEYNOTE | Code 2019 | Speaker: Mary Meeker
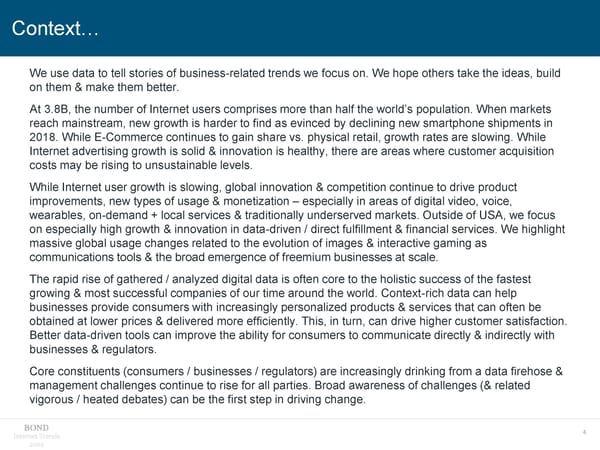
Data Volume Share = EMEA Leads… Followed by Fast Rising China…USA Falling New Data Captured / Created / Replicated by Region, per IDC 40% (%) l a b Glo l, 20% ta o T f o re a h S 0% 2018 2010 2012 2014 2016 2018 2020 2022 2024 EMEA China USA Asia (Ex-China) ROW Source: IDC ‘Digitization of the World From Edge to Core White Paper’ developed in collaboration with Seagate (11/18), IDC DataSphere. IDC estimates that China’s Data captured / created / replicated will grow 30% annually for next 7 years owing to more Internet users creating more data in China & Internet Trends China’s above average usage of video surveillance – video is by far the most data-intensive type of data commonly captured / created / replicated today. 154 2019 EMEA’s datasphere is the largest in the world today owing, in part, to their mature use of video surveillance technology. Note: EMEA = Europe, Middle East & Africa. ROW = Rest of World. Note: 2018 = last full year before release of report. 2019-2025 are estimated from current trends.
The data-driven world will be always on, always tracking, always monitoring, always listening & always watching – because it will be always learning. What we perceive to be randomness will be bounded into patterns of normality by sophisticated artificial intelligence algorithms that will deliver the future in new & personalized ways. Artificial intelligence will drive even more automation into businesses & feed processes & engagements that will deliver new levels of efficiency & products that are tailored to business outcomes & individual customer preferences. Today, companies are leveraging data to improve customer experiences, open new markets, make employees & processes more productive & create new sources of competitive advantage… Traditional paradigms will be redefined (like vehicle or white goods ownership) & ethical, moral & societal norms will be challenged… David Reinsel / John Gantz / John Rydning – IDC, The Digitization of the World – From Edge to Core, 11/18 Internet Trends 155 2019
Data Volume + Utilization… Technology Change > Human Adaptability Humans’ ability to adapt to 14 technological change is increasing, Technology but it is not keeping pace with the speed 12 of scientific & technological innovation. To overcome the resulting friction, 10 humans can adapt by developing e We Are skills that enable faster learning & g Here quicker iteration & experimentation. n 8 Potential Human Cha Adaptability Acceleration f Owing to Faster Learning & o Developing these skills is particularly important 6 Smarter Regulation e for policy makers & regulators who are looking Rat to protect the public interest. They need to be 4 Human ready to try new approaches, iterate & Adaptability change with the times so tech progress goes hand in hand with public benefit. 2 Astro Teller – X, The Moonshot Factory 0 Adapted from Thomas Friedman’s Thank You For Being Late, 2016 Time Source: Adapted from quotes originally appearing in ‘Thank you For Being Late’ by Thomas Friedman, 2016. Updated in June 2019 by Astro Teller. Internet Trends 156 2019
Consumers + Businesses + Regulators = Increasingly Drinking from Data Firehose Source: The Canadian Press Internet Trends 157 2019
…INTERNET USAGE = THERE ARE CONCERNS…THERE IS GOODNESS Internet Trends 158 2019

This is a modal window.
Usage Concern = Overload… Internet Trends 159 2019
Adults ‘Almost Constantly’ Online = 26% vs. 21% Three Years Ago % of Adults Online ‘Almost Constantly’ Overall By Age Group 30% 26% 18-29 2015 36% 2018 39% A 21% US , 28% ts 30-49 en 36% nd15% po Res 12% 50-64 % of 17% 65+ 6% 8% 0% 2015 2018 All Adults 0% 25% 50% Pew Survey (USA) % of Respondents in Pew Survey, USA Source: Pew Research (7/15 + 1/18) Internet Trends 160 2019
Social Media = Positive & Negative Do Social Media Platforms You Use Make These Health-Related Factors Better or Worse? Self-Expression Self-Identity Better / Community Building Positive Emotional Support Awareness of Others Access To Health Info Real-World Relationships Loneliness Average Depression Anxiety Worse / Body Image Negative Bullying Fear of Missing Out Sleep Quality / Amount More Negative More Positive Source: Royal Society For Public Health Survey of 1,479 British teens in ‘early-2017’ Each teen was asked to rate 5 of the most popular social networks (YouTube, Facebook, Twitter, Snapchat & Instagram) on each dimension. Data presented = average of scores for each social network. Internet Trends . 161 2019
Digital Media = Users Taking Action to Reduce Usage % of Adults Trying to Limit Personal Parent Actions to Regulate Children’s Smartphone Use, USA Internet / Phone Usage 70% 60% 57% 63% 52% A A 47% US , 39% US ts s, en ent nd d po n 35% 30% o p Res Res f arent o P 16% % % of 0% 0% Used Digital Used Digital 2017 2018 Used Parental Controls For Used Parental Controls For Websites Phone Use Parental Controls Parental Controls for Websites for Phone Use 2015 2018 Pew Survey (USA) Source: Deloitte Mobile Consumer Survey, US (11/18) Pew Research (7/15 + 1/18) Internet Trends 162 2019
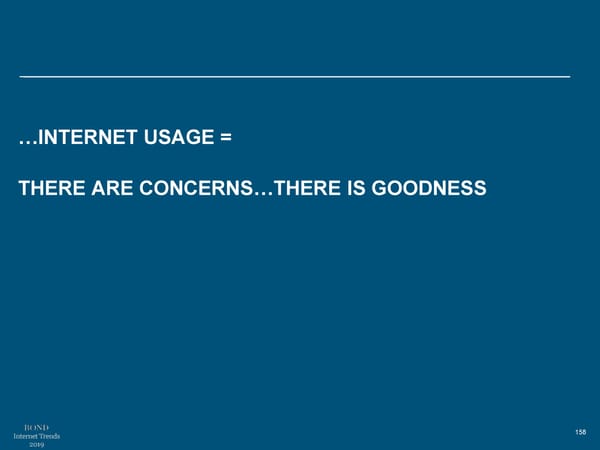
Digital Media = Businesses Taking Action to Help Users Monitor Usage 2018 Major Platforms Launched Wellness / Time Tracking Features Apple Google Facebook YouTube Screen Time Digital Wellbeing Your Time on Facebook Time Watched Source: Apple, YouTube, Google, Facebook Internet Trends 163 2019
Social Media Usage = Decelerating… +1% vs. 6% Y/Y Daily Time Spent on Social Media, Global 2.4 16% ar) ) B ne ue l Li B ( ed nt R ( pe1.2 8% Y S / s Y r h, ou t H ow r y l G ai D 0 0% 1/14 1/15 1/16 1/17 1/18 1/19 Source: Hootsuite & WeAreSocial Digital 2019 report (1/19). Note: 2019 Estimate owing to the fact that users were surveyed in January 2019, before they have completed the year 2019. Internet Trends 164 2019
…Usage Concern = Privacy… Internet Trends 165 2019
Digital Media = Privacy Concerns High But Moderating People More Concerned About Internet Privacy vs. One Year Ago, Global 80% 64% ts 52% n e d n o p 40% s Re f % o 2015 – Anthem Health announces that 2017 – Equifax reveals the personal 80MM personal health financial records of records were stolen in a over 145MM Americans owing to an ‘sophisticated attack’ unsecured web portal 2014 – The New York Times reports on 2016 – Yahoo! reveals that 3B 2018 – The New York Times reveals NSA documents showcasing government Customer records, including names, Cambridge Analytica improperly tracking of USA smartphone use address & encrypted passwords were accesses 87MM Facebook profiles breached 0% 2014 2015 2016 2017 2018 Source: CIGI-IPSOS Global Survey on Internet Security & Trust 2014, 2016, 2017, 2018. 2018 = 24,750 Internet users from 12/29/17-3/5/18. 2017 = 24,225, 2016 = 24,143, 2014 = 23,376. Internet Trends 166 2019
Regulators / Businesses = Improving Consumer Privacy Control Regulators Mandating Businesses Improving Privacy Rules / Policies Privacy Management EU - GDPR California State Facebook Google Passed – 2016 Passed – 2018 2018 2019 Effective – 2018 Effective – 2020 Source: Facebook (5/18). Google (4/18). EU – (3/18) State of California (6/18) Internet Trends 167 2019
Digital Media = Encrypted Messaging / Traffic Rising Rapidly Select Messenger MAUs % of Web Traffic Encrypted 8B 100% 87% ers l e Us a v b o ti l 53% c 4B G A , c y i l f 50% f a nth r T Mo b e W f % o 0 0% 2014 2015 2016 2017 Q1:16 Q3:16 Q1:17 Q3:17 Q1:18 Q3:18 Q1:19 Default End-to-End Encryption Optional / Announced End-to-End Encryption No End-to-End Encryption Source: Google, Tencent, Twitter, Facebook, Apple, Telegram releases & Morgan Stanley estimates. Note: *iMessage2 MAUs calculated by install base of Apple iPhones, as estimated by Credit Suisse (2014-2017). WhatsApp employs end-to-end encryption by default. Facebook Messenger has end-to-end encryption capabilities but users have to Internet Trends manually enable them. Instagram does not have end-to-end encryption but Facebook is planning to add that feature & make Facebook Messenger encrypted by default (1/19). All 168 2019 Gmail messages are encrypted at rest and in transit. Fortinet Q3:18 Quarterly Threat Landscape Report (11/18). HTTPS = Hyper Text Transfer Protocol Secure is the secure protocol over which data is sent between the browser and the website the user is connected to.
…Usage Concern = Problematic Content / Activity Internet Trends 169 2019
More Than Half of Humanity (& Rising) = Online Internet Penetration, 2018 60% 51% l a b Glo , n tio30% tra e 24% n e P t rne te In 0% 2009 2010 2011 2012 2013 2014 2015 2016 2017 2018 Source: CIA World Factbook, United Nations / International Telecommunications Union, USA Census Bureau. Internet user data is as of mid-year. Internet user data: Pew Research (USA), China Internet Network Information Center (China), Islamic Republic News Agency / InternetWorldStats Internet Trends / Bond estimates (Iran), Bond estimates based on IAMAI data (India), & APJII / GlobalWebIndex (Indonesia). 170 2019
Media Maxim = People Prefer Negative News (2014)… We use a lab experiment to capture participants’ news selection biases, alongside a survey capturing their stated news preferences… regardless of what participants say, they exhibit a preference for negative news content. Marc Trussler & Stuart Soroka – Consumer Demand for Cynical & Negative News Frames, 3/14 Source: The Journal of Media Economics (11/14) & The International Journal of Press / Politics (12/15). Internet Trends 171 2019
…Media Maxim = People Prefer Negative News (1909) No one attempting to derive an estimate of the present conditions in New York from the front page contents of our many newspapers could be blamed for concluding that society is on the verge of deplorable anarchy. James E. Rogers – University of Chicago Press, Quoting The Evening Post in The American Newspaper, 1909 Internet Trends 172 2019
Problematic Content on Internet = Can Be Less Filtered + More Amplified Internet Trends 173 2019
Images / Streaming = Can Be More Powerful Than Text Then Now News via Edited Text News via Live Images Source: The Library of Congress, The New York Times, Pixabay, Ring Internet Trends 174 2019
Algorithms = Can Amplify Users Own Patterns Newsfeeds Curated Using… Search Reading Followed App Followed History History Accounts Interactions Interests Google Apple Twitter Toutiao Reddit Source: Google, Apple, Twitter, ByteDance, Reddit Internet Trends 175 2019
Social Media = Can Amplify Trending Topics Do You Ever Get News or News Headlines from ____ ? 50% 43% Facebook %) ( nts de on25% esp 21% YouTube R of e r 12% Twitter ha S 0% 2013 2014 2015 2016 2017 2018 Pew Survey (USA) Source: Pew Research (9/18). Note Survey = 4,581 respondents interviewed between 7/30/18 & 8/12/18 vs. historical data from 2016 & 2013. Note: Instagram / LinkedIn / Reddit / Snapchat / WhatsApp / Tumblr not shown owing to less than 10% of respondents using them to get news in 2018. Internet Trends 176 2019
Traditional Media Platforms = Can Amplify Social Media Trending Topics % Articles Citing Content Originally Posted To Facebook / Twitter (Leading Newspapers*) 6% The topics for which Facebook & Twitter are most commonly er sourced [in newspaper articles] are t t i similar across all countries – Tw / among them are soft news topics as k well as hard news topics such as ceboo domestic & international politics, Fa 3% breaking-news events or reporting ng i t i on movements, the last of which C es highlights the relative advantages of cl i t r social media as a A % source for journalists. Gerret von Nordheim et al. – Sourcing the Sources, 6/18 0% 2010 2012 2014 2016 Source: Sourcing the Sources – Bournemouth University. *An analysis of the use of Twitter & Facebook as a journalistic source over 10 years in The New York Times, The Guardian, & Süddeutsche Zeitung (leading newspapers in USA / UK / Germany). Analysis conducted by collecting articles from 2006-2016 across all 3 newspapers & running natural language Internet Trends processing models on the text to identify articles that mention Facebook or Twitter as sources 177 2019
Social Media = Can Amplify Bad Behavior I Have Experienced _____ Online 42% = Offensive Name-Calling 32% = Spreading of False Rumors 16% = Physical Threats Pew Survey (USA Teens) Source: Pew Research (9/18). Note: survey = 731 respondents age 13-17 interviewed between 3/7/18 & 4/10/18 Internet Trends 178 2019
Motivated Bad Actors = Can Amplify Ideologies The main terrorist problem in the United States today is one of individuals radicalized by a diverse array of ideologies absorbed from the Internet. Peter Bergen & David Sterman – The Real Terrorist Threat in America - Foreign Affairs, 10/18 Internet Trends 179 2019
Unintended Bad Actors = Can Amplify Misinformation The Internet plays a role in fostering distinct & polarized online communities among conspiracy theory believers... Believers share their opinions & ‘evidence’ with other believers but are less willing to share with people who are critical of conspiracy theories – with the Internet, conspiracy groups become more homogeneous & their beliefs become stronger over time. Karen Douglas – Professor of Social Psychology, The University of Kent Writing for The Conversation, 6/18 Internet Trends 180 2019
Extreme Views = Can Amplify Polarization Polarization has been abetted by many factors. Americans are sorting themselves out geographically, living in increasingly politically homogeneous neighborhoods. Social media & the proliferation of media channels via the Internet & TV has played a role, allowing people to communicate exclusively with people like themselves. Identity & the growth of identity politics have also played a role – People have gravitated toward groups that feel they are in a zero-sum competition against one another. Francis Fukuyama – Stanford University, Professor of Political Science, 12/18 Distribution of Democrats & Republicans On 10-item Scale of Political Values, per Pew Research, USA Pew Survey (USA) Note: Ideological consistency based on a scale of 10 political values questions (see methodology).The blue area in this chart represents the ideological distribution of Democrats & Democratic-leaning independents; the red area of Republicans & Republican-leaning independents. The Internet Trends overlap of these two distributions is shaded purple. Source: Pew Surveys conducted 1994-2017. Stanford release. 181 2019
Internet Platforms = Driving Efforts to Reduce Problematic Content Facebook YouTube Content Items Removed vs. Videos Removed for Community Guideline Violations vs. % Hate Speech Identified / Removed Before User Report Share Flagged / Removed Before First View 90MM 80% ) s10MM 80% ar) ne on ) B Li ati ol ne ue i l Red V Li B ( ( ne i m ng l Red ( pa de ui ew S G i ng t V i ty i s er Reporti r ud un i l F c Us m x E ore , 45MM 40% ore Com5MM 40% ef ed ef o B B ov T ed ed ng ov Rem ov i t w O en Rem Rem h ed os Cont ec ov de pe of Rem % Vi es os ec i de P i % Hate S V 0 0% 0 0% Q4:17 Q1:18 Q2:18 Q3:18 Q4:18 Q1:19 Q4:17 Q1:18 Q2:18 Q3:18 Q4:18 Q1:19 Source: Facebook Community Standards Enforcement Report (5/19). Pieces of content include posts, photos, videos or comments that were taken down due to violation of community guidelines. Taking action could include removing a piece of content from Facebook, covering photos or videos that may be disturbing to some audiences with a Internet Trends warning, or disabling accounts. Spam not included due to the scale (Billions of pieces of content removed quarterly. YouTube Community Guidelines enforcement Report (5/19). 182 2019 YouTube Community Guideline Violations can include sexual content, graphic / violent content, harassment, etc.
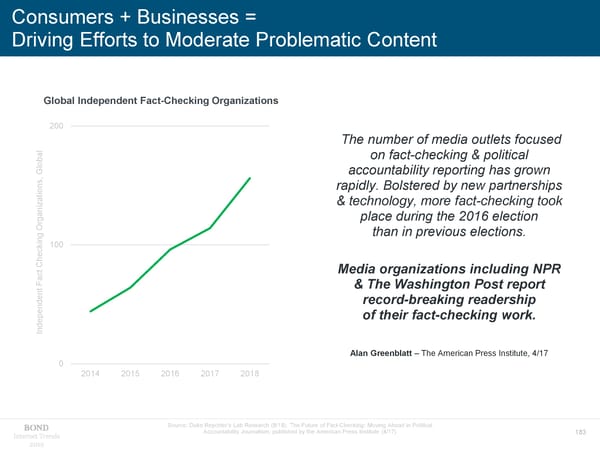
Consumers + Businesses = Driving Efforts to Moderate Problematic Content Global Independent Fact-Checking Organizations 200 The number of media outlets focused obal on fact-checking & political l accountability reporting has grown G , rapidly. Bolstered by new partnerships ons ati & technology, more fact-checking took z gani place during the 2016 election r O than in previous elections. ng i100 k t Chec Media organizations including NPR ac F & The Washington Post report ent record-breaking readership Independ of their fact-checking work. Alan Greenblatt – The American Press Institute, 4/17 0 2014 2015 2016 2017 2018 Source: Duke Reporter’s Lab Research (8/18). The Future of Fact-Checking: Moving Ahead in Political Accountability Journalism, published by the American Press Institute (4/17) Internet Trends 183 2019
We can definitely continue to improve how we manage the YouTube platform… I see how much improvement we've already made…If you look back 2 years, there were a lot of articles about how we handled violent extremism… if you talk to experts in this field today, you can see we've made tremendous progress. We are an information company - we committed last year to having >10,000 people moderating content… I see how much progress we've already made. We just made changes to our recommendation algorithms for borderline content & we've announced we've seen a 50% reduction in the views coming from recommendations on that content. If you combine much better policies with technology to do that at scale, I think you can be at a much better place. Susan Wojcicki – CEO, YouTube, Interview @ Code Conference, 6/19 The Department of Homeland Security has engaged with major social media companies to encourage them to continue to police their websites… We do see that those efforts are bearing some fruit – I think we have a long way to go & we look forward to continue to engage with social media companies in that environment. Brian Murphy – Principal Deputy Undersecretary, Department of Homeland Security, Testimony to USA Congress, 5/19 Internet Trends 184 2019
Perception of Internet (USA) = Largely Positive for Individuals + Society When You Add Up Internet Advantages & Disadvantages of The Internet, It Has Been _____ for Me / Society 100% 90% 88% ts 76% n 70% e d n o Resp50% f o re a h S 0% For Me = For Society = Mostly Good Mostly Good 2014 2018 Pew Survey (USA) Source: Pew Research. Poll of 1,785 USA Internet users from 1/3/18-1/10/18 & 2015, released on 4/30/18. Internet Trends 185 2019
Age-Old Challenge of Amplifying Good + Minimizing Bad = Taking Rapid Twists & Turns Internet Trends 186 2019
Global Relationships Related to Information + Data = Evolving Differently / Rapidly Internet Trends 187 2019
In a sense, the World Wide Web as we know it is over… in its place is something altogether different: a Balkanized ‘splinternet’…where your experience online is determined by local regulation. Mark Scott – Chief Technology Correspondent, Politico, 12/17 & 2/18 We need a new generation of laws to govern a new generation of tech. Brad Smith – President & Chief Legal Officer, Microsoft, 2/18 There’s a paradigm shift going on… Governments are moving from a position of non-interference to a realization that if we want to keep a cross-border Internet going, then we [need] a new system of governance. Paul Fehlinger – Co-Founder, Internet & Jurisdiction Policy Network, 2/18 Note: ‘Splinternet’ originated by Clyde Wayne Crews Jr. writing for the Cato Institute in 2001. Internet Trends 188 2019
Global Internet Freedom… Partly-Free = Rising…Free / Not-Free = Falling Freedom House –Freedom on the Net (Global, 2018) Internet Users Live in a Country Where ______ Internet Population ‘Internet Freedom Status’ 55% 40% Political, social, or religious content 35%34% is censored / blocked 33% %) 29% ( 47% al ob l 24% Government Internet surveillance G , powers have increased over past year on 20% ati20% ul op P 47% f Access to certain social media / e o r messaging platforms have been blocked ha S 42% Government has disconnected Internet / mobile networks often for political reasons 0% Free Partly-Free Not-Free 2016 2018 Source: Freedom on The Net Reports 2016 + 2018. Note: Freedom on the Net measures the level of Internet & digital media freedom in 65 countries. Each country receives a numerical score from 0 (the most free) to 100 (the least free), which serves as the basis for an Internet freedom status designation of FREE (0-30 points), PARTLY FREE (31-60 points), or NOT FREE (61-100 points). Ratings are determined through an examination of Internet Trends three broad categories – Access (Assesses infrastructural & economic barriers to access). Content Limits (Examines filtering & blocking of websites) & User Rights (Measures legal protections & restrictions on online 189 2019 activity; surveillance; privacy; & repercussions for online activity, such as legal prosecution, imprisonment, physical attacks, or other forms of harassment. Scores do not add to 100 owing to non-analyzed countries.
Global Internet Freedom Framework (Freedom House) Freedom House Freedom on The Net Index Measures a country’s level of Internet / digital media freedom, using questions derived from Article 19 of UN’s Universal Declaration of Human Rights: Everyone has the right to freedom of opinion & expression; this right includes freedom to hold opinions without interference & to seek, receive & impart information & ideas through any media regardless of frontiers. Countries are given points for: 1) Obstacles to Access; 2) Limits on Content; 3) Violations of User Rights Free Countries with low economic / infrastructural / regulatory barriers to Internet access… minimal blocking / filtering of content / information…strong privacy protections Partly-Free Countries with some barriers to Internet access (like state-owned providers handicapping competition)… some blocking of content / information (like news sites or temporary blocks on social media)… some privacy violations (like data collection requirements with weak judicial oversight) Not-Free Countries with strong barriers to Internet access (like cutting off the internet to certain regions) …strong blocking of content (news sites, opposition figures, permanent blocks on social media)… rampant privacy violations (like data localization requirements with low judicial independence, unchecked surveillance) Source: Freedom House’s Freedom on The Net Reports 2016-2018. Note: Freedom on the Net is a collaborative effort between a small team of Freedom House staff & an extensive network of local researchers & advisors in 65 countries. Freedom on the Net’s in-country researchers have diverse backgrounds—academia, blogging, traditional Internet Trends journalism, & tech— & track developments from their country of expertise. In the most repressive environments, Freedom House takes care to ensure researchers’ 190 2019 anonymity or, in exceptional cases, works with foreign nationals living outside their home country.
World Wide Web = Webs of Worlds Driven by Local Regulation… Internet Regulation High Low USA 7 Largest EU India China Economies* Global Internet User % 8% 8%* 12% 21% • Diverse regulatory • Diverse regulatory • Diverse regulatory • Central government bodies with varied / bodies with varied / bodies, many with power bodies with strong Internet distinct powers distinct powers to regulate access regulatory power Access • Privately-owned • Privately-owned • Government initiative to • High government telecom infrastructure telecom infrastructure increase Internet access ownership / control of accessible to nearly all accessible to nearly all & usage as a network infrastructure with residents residents ‘public good’ ability to regulate access • Virtually no content • Limited content • Event-driven content • Strong content regulation filtering & strong free filtering & free speech filtering often without & no expectation of Content speech protections protections direct public input with speech protection Regulation • No political censorship, • Limited political some speech protection strong protection for censorship, some • Some censorship, • Regulation to ‘create a hosts of user-generated liability for hosts of generally to remove more harmonious content user-generated content ‘insulting content’ digital society’ • Some legal privacy • Strong legal privacy • Some legal privacy • Ability to collect user protections related to protections related to protections related to data for regulatory User government collection any collection of user government collection of purposes Regulation of user data data user data • Limited regulation on • Limited regulation on • Required government • Required government encryption / secure encryption / secure approval for encryption / approval for encryption / communication communication secure communication secure communication Legend Limited Regulation Moderate Regulation Strong Regulation Note: *Based on analysis of Germany / UK / France / Italy / Spain / The Netherlands / Sweden – 7 largest economies in The European Union, representing >70% of The EU GDP in 2018 & a majority of votes in the EU Parliament…Individual policies vary across The EU, in particular, some eastern European Union countries (e.g., Hungary) significantly limit Internet freedom in stark contrast to Internet Trends more open EU nations. Analysis also takes into account EU-wide directives, such as GDPR. Source: Adapted from Freedom House 2018 Freedom on the Net Report. Global Internet User % as of 191 2019 2018 per CIA World Factbook, United Nations / International Telecommunications Union, USA Census Bureau. Internet user data is as of mid-year. Internet user data: Pew Research (USA), China Internet Network Information Center (China), estimates based on IAMAI data (India).
…World Wide Web = Webs of Worlds Driven by Local Regulation Global Internet Regulatory Observations per Foreign Affairs (9/18) USA European Union In 1997, USA negotiated an agreement through the World Trade The GDPR has…created a blueprint that other states & Organization that committed 67 signatory countries to organizations will study closely as they, too, seek to properly ‘procompetitive regulatory telecommunications principles’… balance individuals’ rights to data protection with their other As the Internet grew more centralized & as its role expanded, rights & with the legitimate interests of business & government. policymakers failed to keep up. When it came to updating The law’s main innovation is to establish a bedrock principle of regulations for online activities…the Internet was treated as a accountability. It places responsibility for properly collecting & special realm that did not need regulation & the bad guys took notice. processing personal data squarely on organizations & extends to individuals the right to prevent their data from being collected or processed. The GDPR also gives Karen Kornbluh – Senior Fellow for Digital Policy, Council on Foreign Relations individuals the right to insist that their data be deleted. Helen Dixon – Data Protection Commissioner, Ireland India China When a service provider sends an authentication request to Chinese leaders want to ensure a harmonious Internet – one that Aadhaar (India’s National Identity System), the purpose of the guides public opinion, supports good governance & fosters authentication is not revealed; all the government knows is when economic growth but also is tightly controlled… someone uses his Aadhaar number, not where or why. [Aadahaar shows] India’s approach to the Internet China has promoted ‘cyber-sovereignty’ as an organizing is simple – empower users with the technical & principle of Internet governance…China envisions legal tools required to take back control of their data. a world of national Internets, with government control justified by the sovereign rights of states. Nandan Nilekani – Founding Chair of Unique Identification Authority of India Adam Segal – Chair, Emerging Technologies & National Security, Council on Foreign Relations Source: ’World War Web,’ Foreign Affairs, September / October Edition 2018 Internet Trends 192 2019
Open Internet = Can Benefit All Constituents Internet Trends 193 2019
Open Internet = Core Constituent Motivations Consumers Want to Get What They Want Efficiently & Inexpensively Businesses Want to Sell Products & Services Profitably Regulators Want to Protect Consumers / Businesses / Social Institutions Internet Trends 194 2019
Open Internet = Online Reviews Can Boost Multi-Sided Accountability… Do Online Consumer Reviews / Government Oversight Help ‘A Lot’ to _________ Ensure Safety of 41% Ensure Safety of Products / Services Products & Services 33% Make Companies 45% Make Companies Accountable to Consumers Accountable to Consumers 30% Make Consumers Feel 46% Make Consumers Feel Confident About Purchases 25% Confident About Purchases 0% 25% 50% Consumer Reviews Government Oversight Pew Survey (USA) Source: Pew Research Survey (12/15). N = 4,787 USA Consumers. Internet Trends 195 2019
…Open Internet = Online Reviews Can Boost Multi-Sided Accountability Airbnb Total Host / Guest Reviews on Airbnb 90MM Safety is our number one principle at Airbnb, the whole thing only works if s ew you feel safe – we have a few hundred i people on our Trust & Safety Team Rev t s who really work with the ue G Airbnb community to facilitate that. ng i k oo45MM B 70% of guests – when they stay on & nt Airbnb – leave a review, which ou c means we’ve built a system that c t A allows the community to review Hos l properties on Airbnb & build trust. ota T Brian Chesky – CEO, Airbnb, 4/19 0 2013 2014 2015 2016 2017 2018 Source: Total host / guest reviews per Airbnb (6/19). Each booked trip taken on Airbnb can have 0-2 reviews depending on if the host account and/or booking guest writes a review. Brian Chesky quote per interview on CBS News (4/19) Internet Trends 196 2019
Reveals / Actions / Reactions Amplified on Internet = Can Drive Transparency + Rapid Change for Consumers / Businesses / Regulators Internet Trends 197 2019
Reveal / Action / Reaction… Twitter = Communication Tool for Citizens… Humanitarian Concerns JJ Watt Hurricane Blood Emergency Harvey Relief Donors India Rescue $42MM Raised… …11K Donations… …Accident -> Safety 1 Year 1 Year <3 Hours (2017) (2017) (2010) Source: Twitter (7/10-8/17) Internet Trends 198 2019
…Reveal / Action / Reaction… Twitter = Communication Tool for Consumers + Businesses Consumer / Business Concerns Starbucks Glossier Under Armour Starbucks Security Policy… …New Packaging… …New Steph Curry Shoe Sizes <2 Days <1 Day <1 Week (2018) (2019) (2018) Source: Twitter (4/18-4/19) Note: Under Armour included ‘Curry 5’ shoes in the ‘Girl’s Shoes’ section of their website & updated sizing nomenclature to “Grade School” rather than ‘Boys.’ Internet Trends 199 2019
Reveal / Action / Reaction… Social Media = Communication Tool for Citizens + Regulators Social Media is Important For _________ 69% Getting Government Officials to Pay Attention to Issues 67% Creating Sustained Movements for Social Change 58% Influencing Government Policy Decisions Pew Survey (USA) Source: Pew Survey of 4,594 USA adults (6/18). Note: Percentages = respondents who responded ‘very important’ or ‘somewhat important’ Internet Trends 200 2019
Open Internet = Can Be Messy, But Effective… Consumer / Business / Regulators = Key to Work Together to Amplify Good + Minimize Bad Internet Trends 201 2019
During the first two-decades of the Internet’s growth, too much faith was put in the technology itself. Not enough was done to address challenges such as the spread of surveillance technologies, abuse of online platforms & the general undermining of trust. …[governments] should work to establish better baselines & metrics to assess the Internet’s true impact, as well as the kinds of actions that enable the good & mitigate the bad. Advocates for the open Internet should acknowledge that regulation can help, while remaining vigilant to unintended consequences. …all of these stakeholders should continue to forge coalitions that work across borders in support of flexible, focused & rights-compliant efforts to improve freedom online. Jason Pielemeier – Policy Director, The Global Network Initiative, Council on Foreign Relations Blog, 7/18 Internet Trends 202 2019
First Step in Long Journey = An Algorithmic Bill of Rights? Crowdsourced Algorithmic Bill of Rights, per Sigal Samuel @ Vox 1) Transparency 2) Explanation 3) Consent 4) Freedom from Bias 5) Feedback Mechanisms 6) Data Portability 7) Redress 8) Algorithmic Literacy 9) Independent Oversight 10) Federal / Global Governance Source: In early 2019, Vox reached out to 10 experts (including Kartik Hosanagar – original proposer of an Algorithmic Bill of Rights) at the forefront of investigating how Artificial Intelligence risk is creeping into multiple aspects of life. Vox reporter Sigal Samuel asked them each to Internet Trends 203 2019 name a protection the public needs enshrined in law, resulting in a crowdsourced, proposed Algorithmic Bill of Rights. Full detail available - https://www.vox.com/the-highlight/2019/5/22/18273284/ai-algorithmic-bill-of-rights-accountability-transparency-consent-bias
Highly Regulated Internet = Can Favor State Control Internet Trends 204 2019
A fundamental First Amendment principle is that all persons have access to places where they can speak & listen & then, after reflection, speak & listen once more. Today, one of the most important places to exchange views is cyberspace, particularly social media, which offers relatively unlimited, low-cost capacity for communication of all kinds. Anthony Kennedy –Former USA Supreme Court Justice – Majority Opinion, Packingham v. North Carolina, 6/2017 If there be time to expose through discussion the falsehood & fallacies, to avert the evil by the processes of education, the remedy to be applied is more speech, not enforced silence. Louis Brandeis – Former USA Supreme Court Justice – Concurring Opinion, Whitney v. California, 5/1927 I urge improving the governance capacity in cyberspace & developing a governing network led by the [Communist Party of China]. Internet media should spread positive information, uphold the correct political direction & guide public opinion & values towards the right direction. Internet service providers should take responsibility to prevent cyberspace from degrading into a platform full of harmful, false & provocative information. Xi Jinping – President of The People’s Republic of China, As Translated by Xinhua, 4/2018 Source: USA Supreme Court (6/17). As translated to English by official China State media (Xinhua, 4/18) Internet Trends 205 2019
Cyber Attacks = Sophistication + Scope Continue to Rise Internet Trends 206 2019
Cyber Attacks = Evolving Sponsors / Targets / Asks / Detection 1) State-Sponsored Actor Attacks = Rising USA / UK / The Netherlands / Germany Have Publicly Indicted State-Actors 2) Large-Scale Data Provider Attacks = Rising Cloud Providers / Telecoms / Data Brokers Seeing Elevated Attack Activity 3) Monetary Extortion Cases = Rising Non-Attributable Currencies (e.g., Crypto) Enabling Anonymous Ransom Payments 4) Attack-to-Detection Dwell Time = Continues To Fall Average Days = 78 (2018)…101 (2017)…416 (2011) Source: FireEye M-Trends Report 2019 Internet Trends 207 2019
Cyber Attacks = Opportunities Created by Online System Weaknesses Data Center Operators – Downtime Experienced in Past Year per Uptime Institute 40% 31% %) ( 25% A financial services firm engaged a Mandiant Red nts Team to evaluate the effectiveness of its information de security team’s detection, prevention & response on20% capabilities. The team was able to obtain full esp R administrative control of the company domain & compromise all critical business applications without of e any software or operating system exploits. r ha S Instead, the team focused on identifying system misconfigurations, conducting social engineering attacks & using the client’s internal tools & documentation. FireEye Threat Research, 4/19 0% 2017 2018 Source: Uptime Institute 2018 Report. FireEye Note: Uptime Institute is a professional services organization best known for its data center tier standards for data center uptime. Each year, it conducts a survey of 900 data center operators on a variety of topics, including data center outages. Internet Trends 208 2019
2-Factor Authentication = Incomplete Adoption Limits Effectiveness % Sites Supporting 2-Factor Authentication, Global* 60% 54% 52% 30% Security experts have seen a significant uptick in the number of clients securing their VPN or remote access infrastructure with multi-factor authentication. However, there is frequently a lack of multi-factor authentication for applications being accessed from within the internal corporate network. 0% FireEye Threat Research, 4/19 2014 2015 2016 2017 2018 Source: Elie Bursztein (Security & Anti-Abuse Lead @ Google). analysis of dongleauth.info database data (12/18). FireEye (4/19) Internet Trends 209 2019
Cyber Attacks = Increasingly Focused on Sensitive Data Sensitive Records Exposed in Security Breaches 500MM As more & more customers move to al 447MM ob l G software as a service & cloud, , s he attackers are following data. c ea r B y Attacks against cloud providers, urit ec telecoms & other organizations S n 250MM i with access to large ed 198MM s 178MM po amounts of data… x E increased in 2018. ords Rec l FireEye M-Trends Report 2018 ua 37MM nn A 0 2015 2016 2017 2018 Source: Identity Theft Resource Center (2014-2018). MalwareBytes 2019 State of Malware Report. Note: Trojan malware = malware specifically designed to evade detection by security software. Observed volume calculated as an average of monthly observations for a quarter. A sensitive record defined as personal information that could be used to commit a crime against a victim exposed Internet Trends 210 2019 due to an online security breach (e.g., bank credentials being accessed illicitly). Variation in number of records often driven by large individual breaches. In 2015, Anthem Health revealed 78MM personal records via breach. In 2017 Equifax exposed ~150MM personal records via breach. In 2018, Marriott International exposed ~383MM records via breach.
Cyber Attacks = Effects Amplified by State Sponsorship States are using the tools of cyberwarfare to undermine the very foundation of the Internet: trust. They are hacking into banks, meddling in elections, stealing intellectual property & bringing private companies to a standstill. The result is that an arena that the world relies on for economic & informational exchange has turned into an active battlefield. Cyber-operations are emblematic of a new style of competition… In operation after operation, many of them hardly registered by the wider world, states are weaponizing the Internet. All these incidents occurred in a gray zone of conflict – below the threshold of outright war but above that of purely peacetime behavior. Michèle Flournoy & Michael Sulmeyer – Co-Founders, WestExec Advisors, Foreign Affairs, 9/18 Internet Trends 211 2019
WORK = STRONG ECONOMIC INDICATORS… INTERNET-ENABLED SERVICES / JOBS HELPING Internet Trends 212 2019

This is a modal window.
Global Relative GDP (Current $) = China + USA + India Rising…Europe Falling Global GDP Contribution (Current $) 40% 40% GDP26% l 25% a b Glo20% 22% f % o 15% 6% 7% 4% 3% 3% 0% 1960 1970 1980 1990 2000 2010 2017 USA Europe China India Latin America Source: World Bank (GDP in current $). Other countries account for ~30% of global GDP. Internet Trends 213 2019
Cross-Border Trade = 29% of Global GDP… Foundational to Global Economy Trade as % of Global GDP 40% DP G al ob l 20% G % of 0% 1960 1965 1970 1975 1980 1985 1990 1995 2000 2005 2010 2015 2017 Source: World Bank. Note: ‘World Trade’ refers to the average of Imports & Exports (to account for goods in-transit between years) for all nations. Internet Trends 214 2019
Global Relative Unemployment Concern = High… USA = Low… Are unemployment & jobs among top three worries for your home country? Ipsos / Reuters Surveys 40% 38% y 34% 33% el v i t osi P g 24% erin nsw 20% A 17% nts de 11% on esp R % 0% 2/17 3/18 3/19 2/17 3/18 3/19 World Average USA Source: Ipsos Survey Data of ~20K global respondents. Ipsos conducts this survey on a monthly basis, asking the same questions of a statistically representative sample of >1K people in 28 representative countries. February 2017 included owing to lack of published March 2017 report. World average reflects average of Germany, Israel, UK, USA, Belgium, Internet Trends Japan, Poland, Sweden, China, Hungary, Peru, Turkey, India, Australia, Canada, Mexico, Brazil, Russia, France, Argentina, Saudi Arabia, South Africa, South Korea, Italy & Spain. 215 2019
…Global Relative Unemployment Concern… USA = Materially Below Other Countries… Are unemployment & jobs among top three worries for your home country? Ipsos / Reuters Survey (3/19) Rank Country Share Rank Country Share 1 Italy 69% 14 China 29% 2 South Korea 66% 15 Canada 27% 3 Spain 61% 16 Belgium 24% 4 South Africa 57% 17 Peru 22% 5 Argentina 49% 18 Japan 19% 6 India 44% 19 Israel 18% 7 Turkey 44% 20 Hungary 17% 8 Mexico 38% 21 Sweden 15% 9 Brazil 35% 22 Poland 15% 10 Saudi Arabia 34% 23 UK 14% 11 Russia 33% 24 Germany 11% 12 France 32% 25 USA 11% 13 Australia 30% Source: Ipsos Survey Data of ~20K global respondents. Ipsos conducts this survey on a monthly basis, asking the same questions of a statistically representative sample of >1K people in USA & other countries. Note: Percentages do not add to 100% because respondents were allowed to pick 3 choices. . .’ Internet Trends 216 2019
…USA Relative Unemployment Concern = Low & Falling Which of following are top three worries for your home country (USA)? Ipsos / Reuters Surveys February 2017 March 2018 March 2019 Rank Concern Share Rank Concern Share Rank Concern Share 1 Healthcare 36% 1 Crime & Violence 35% 1 Healthcare 39% 2 Crime & Violence 33% 2 Healthcare 33% 2 Financial/Political Corruption 28% 3 Terrorism 31% 3 Terrorism 29% 3 Immigration 28% 4 Unemployment & Jobs 24% 4 Financial/Political Corruption 23% 4 Moral Decline 26% 5 Financial/Political Corruption 22% 5 Immigration 23% 5 Crime & Violence 22% 6 Immigration 21% 6 Moral Decline 23% 6 Poverty & Social Inequality 21% 7 Moral Decline 20% 7 Poverty & Social Inequality 19% 7 Climate Change 21% 8 Poverty & Social Inequality 19% 8 Unemployment & Jobs 17% 8 Extremism 19% 9 Taxes 17% 9 Extremism 15% 9 Terrorism 18% 10 Education 16% 10 Education 15% 10 Education 15% 11 Climate Change 13% 11 Taxes 14% 11 Taxes 15% 12 Extremism 12% 12 Climate Change 12% 12 Unemployment & Jobs 11% 13 Environmental Threats 9% 13 Environmental Threats 10% 13 Environmental Threats 10% 14 Maintaining Social Programs 7% 14 Inflation 7% 14 Inflation 6% 15 Inflation 6% 15 Maintaining Social Programs 5% 15 Maintaining Social Programs 6% 16 Childhood Obesity 3% 16 Childhood Obesity 2% 16 Childhood Obesity 4% 17 Access To Credit 2% 17 Access To Credit 2% 17 Access To Credit 0% Source: Ipsos Survey Data of ~20K global respondents. Ipsos conducts this survey on a monthly basis, asking the same questions of a statistically representative sample of >1K people in USA. Note: Percentages do not add to 100% because respondents were allowed to pick 3 choices. Internet Trends 217 2019
Consumer Confidence Index (USA) = High & Rising… @ 97 vs. 88 Sixty-Five Year Average Consumer Confidence Index (CCI) 120 USA 88= ), 6 65-Year Average 6 9 1 to60 d e x e d (In I CC 0 1954 1959 1964 1969 1974 1979 1984 1989 1994 1999 2004 2009 2014 2019 Source: St. Louis Federal Reserve FRED Database. Note: Indexed to Q1:66 = 100. Consumer Confidence Index (Michigan Consumer Sentiment Index) is a broad measure of American consumer sentiment, as measured through a 50-question telephone survey of at least 500 USA residents each month. Internet Trends 218 2019
Economy / Employment (USA) = Unemployment @ 19 Year Low… Job Openings @ All-Time High…Wages Rising Real GDP vs. Median Real Weekly Earnings, Unemployment Rate, USA Job Openings, USA All Workers Over 16, USA $24T 30% 10MM $360 e g e a t W P a R * ly t s k GD n e l e ing e a m n W e $12T 15% e l $340 R loy 5MM a p Op u m s e b U o n J U ian d e M $0 0% 0 $320 1928 1958 1988 2018 2000 2006 2012 2018 2000 2006 2012 2018 Civilian Unemployment Real GDP Source: St. Louis Federal Reserve FRED Database, Bureau of Economic Analysis, BLS. Note: Real GDP based on chained 2012 dollars. Unemployment rate = annual average. *A job opening is defined as a non-farm specific position of employment to be filled at an establishment. Conditions include the following: there is work available for that position, the job could start within 30 Internet Trends days & the employer is actively recruiting for the position. Wages refers to usual weekly earnings of wage & salary workers. Usual weekly earnings represent earnings before taxes & other 219 2019 deductions & include any overtime pay, commissions, or tips usually received (at the main job in the case of multiple jobholders). Usual definition per discretion of interviewee.
On-Demand Work = Creating Internet-Enabled Opportunities + Efficiencies Internet Trends 220 2019
Small Business Enabling Payment Processors = Strong Growth Square Gross Payment Volume, Global Stripe Connect – Marketplace Volume Impact* Per Forrester $100B 120% +6.7% e um ol V t en m ay $50B 110% P s os r are G qu S $0 100% 2014 2015 2016 2017 2018 Year 0 Year 1 Year 2 Year 3 Source: Square SEC filings. Forrester Total Economic Impact Survey on Stripe Connect (Stripe’s Marketplace Product) (7/18). Note: A Total Economic Impact Study is a framework to identify the cost, benefit, flexibility & risk factors for an investment decision. Forrester took a multistep approach to evaluate the impact that Stripe Connect can have on an organization, including stakeholder interviews, customer interviews, the development of a Internet Trends composite organization based on the characteristics of interviewed Stripe customers & a financial model that incorporates the effects / risks of Stripe Connect, as identified by Stripe’s customers. Based on interview feedback, 221 Forrester determined that a composite organizations would likely have $475MM in annual transaction volume prior to using Stripe Connect & that Stripe Connect’s features (e.g., improved seller settlement) would result in 2019 increased volume of $47.7MM in Year 1, $66.1MM in Year 2 & $90.6MM in Year 3.
On-Demand Services = Growing Rapidly…Benefitting Local Merchants ~5% of [USA] restaurant business’s $800B in annual sales is delivered – we’re still in the very early innings of the development of on-demand delivery & services. We started DoorDash to help local businesses… ‘local’ has long been the promise of E-Commerce but no one has found a way to help local merchants thrive online – that is the space we focus on. We do this by enabling local merchants to participate in selling convenience. There are a lot of merchants who are ready to make the transition from selling experiences to also selling convenience, which can often reduce their costs. I think this is the biggest business model change in commerce. Tony Xu – Founder / CEO, DoorDash, 6/19 Internet Trends 222 2019
On-Demand Consumers = 56MM + ~2x in Two Years On-Demand Consumers, USA On-Demand Products / Services – Consumer Spend, 2017, USA 60MM 56MM Online Marketplaces ers Transportation um ns Housing d Co an30MM Dem 25MM Food Delivery - On Health & Beauty Other 0 $0 $15B $30B 2016 2017 2018 Consumer Spend, 2017, USA Source: National Technology Readiness Survey (4/18). Note: authored by Rockbridge Associates, Inc. & A. Parasuraman & is co- sponsored by the Center for Excellence in Service, Robert H. Smith School of Business, University of Maryland. The study is Internet Trends conducted online among a representative sample of consumers in a national panel & represents the views of U.S. adults ages 18 & 223 2019 older. The sample size was 1,032 in 2016 & 1,004 in 2017. The margin of error is +/- 3 percentage points. 2018 figures are estimates.
On-Demand Workers = ~7MM +22% Y/Y On-Demand Platform Workers, USA 8MM 6.6MM 5.4MM ers ork 3.9MM W 4MM d an Dem - 2.4MM On 0 2015 2016 2017 2018 Source: Emergent Research (2015-2018) + Intuit (2017). Note: On-demand workers defined as online marketplace workers including transportation and/or logistics for people or products, online talent marketplaces, renting out space. Providing other miscellaneous consumer & business services (e.g. TaskRabbit, Internet Trends Gigwalk, Wonolo, etc.). Workers defined as ‘active’ employees that have done ’significant’ on-demand work within the preceding 6 months. 224 2019
On-Demand Workers = >20MM Applicants on Checkr Platform Since 2015, USA Checkr On-Demand Platform Applicants, USA 10MM As the on-demand economy continues to evolve & transform the world around us, we're seeing a rapid increase in new & A supplemental job creation. Increasingly, this type of work has , US become a key driver of economic growth. ts an c i l pp A Checkr has a front row seat in the on-demand 5MM r k economy, not only to watch the changes unfold, c but also to provide solutions that shape & Che l strengthen it. Our technology is designed to ua nn give employers the information they need to A make informed decisions about their candidates, while helping them scale & grow their business. Daniel Yanisse – Co-Founder / CEO, Checkr, 6/19 0 2015 2016 2017 2018 Source: Checkr (2019) Internet Trends 225 2019
On-Demand Work = Creating Internet-Enabled Benefits On-Demand Work –Motivations, USA Previously Unemployed 47% Learn New Skills 29% Previously Underemployed 27% Flexible Work Hours 24% Additional Income 22% Want to Work with Others 18% Take Care of Parents 14% 0% 25% 50% % of Respondents Source: Wonolo (7/18). N = 1,400 survey respondents Internet Trends 226 2019
On-Demand Platforms = Big Numbers + High Growth Real-Time Internet-Enabled Platforms Marketplaces Uber @ 4MM Driver-Partners Etsy @ 2MM Sellers Airbnb @ 6MM Listings l $60B 6MM l $4B 4MM 250MM 6MM a a les b b a l S l l Glo a l a a Glo e a b , b b , s is b s r d Glo e n Glo Glo ing a Glo , n , , k t h ) , s o $30B 3MM r c S $2B 2MM s ls o a r r a125MM 3MM ing P e e iv t B - ll r r M GM e r is s ( A L s ive s S o s t e Dr o s iv Gr e t Gr c Gu A $0 0 $0 0 0 0 20142015201620172018 2012 2014 2016 2018 2010 2012 2014 2016 2018 Gross Bookings Driver-Partners GMS Sellers Guest Arrivals Active Listings DoorDash @ 1.3MMDashers Wonolo @ 230K Workers VIPKid @ 70K Teachers l 1.4MM l 250K 900K 110K a a b b l l Glo a a Glo , b b s , r s e r Glo Glo h 0.7MM e s k 125K , 450K 55K , a r s s o t r D n e W e h e d c im d u t e t e d S Tea if r L a o 0 b 201420152016201720182019 On 0 0 0 2014 2015 2016 2017 2018 2017 2018 2019 Lifetime Dashers Onboarded Workers Teachers Students Uber Source: Uber DoorDash Source: DoorDash. Note: Lifetime Dashers defined as the total number of people that have dashed on the platform through the end of each year. 2019 figures are as of 5/19. Etsy Source: Etsy. Airbnb Source: Airbnb, Note: Airbnb 2017 & 2018 Guest arrivals based on estimates from total guest arrivals disclosures Internet Trends in 2018 & 2019. 500MM guest arrivals have occurred via Airbnb as of 2019. VIPKid Source: Company Press Releases (3/19). Wonolo Source: Wonolo. 227 2019
Remote Work = Creating Internet-Enabled Work Opportunities + Efficiencies Internet Trends 228 2019
Remote Workers = Rising… ~5% of Americans vs. ~3% in 2000 % Total – Remote Workers 6% 5% A US , y l ote Rem 3% ng i 3% ork W s r e ork % W 0% 2000 2002 2004 2006 2008 2010 2012 2014 2016 Source: USA census Bureau American Community Survey (ACS) (2000-2017). Note: The US Census releases the ACS survey results in Internet Trends September for the previous year. ACS = Survey of ~3.5MM Americans over the course of a year. 229 2019
Remote Workers = Enabled by Online Collaboration Tools Remote Workforce (Zapier) Highest-Use Apps onZapier Y/Y Growth By Remote Teams 1/18-1/19 1) Slack +42% 2) Google Sheets +59% At Zapier, we’ve found that by using a stack of 3) Airtable +37% collaboration tools that work well together, our 100% remote team is able to work more 4) Help Scout +101% efficiently, regardless of where they’re located. It’s important for us to have the ability to instantly access a folder, collaborate on a shared document, or chat in real time. With well-connected tools & processes, any remote employee can feel more focused, productive & in control of their time. Wade Foster – Co-Founder / CEO, Zapier, 6/19 Source: Zapier (6/19). Note Y/Y growth refers to growth in engagement with productivity tools from Internet Trends January 2018 to January 2019 specifically at remote teams who use Zapier for automation. 230 2019
Remote Work = Creating Internet-Enabled Benefits Remote Work –Benefits Flexible Work Hours 47% Ability to Travel 30% More Time with Family 14% Able to Work from Home 13% Other 3% 0% 25% 50% % of Respondents Source: Buffer in partnership with Doist, Hubstaff, Remote-How, RemoteYear, Trello, Workfrom & Internet Trends We Work Remotely, State of Remote Work 2019. N = 2,471 respondents globally. 231 2019
Zoom by Day…Fortnite by Night? Work (via Zoom)… …Play (via Fortnite) Source: Canva (Pixabay). Nintendo. Internet Trends 232 2019
ONLINE EDUCATION = BIG NUMBERS + BIG GROWTH Internet Trends 233 2019

This is a modal window.
Education Costs (USA) Internet Trends 234 2019
Education Costs = Rising Undergraduate Tuition & Fees Student Loan Debt $40K $2T A US , Fees A & US on t, ti ui T $20K Deb$1T te an ua Lo ad t ergr en tud Und S l ua nn A 0 0 1973 1982 1991 2000 2009 2018 2003 2008 2013 2018 Private Non-Profit 4-Year Public 4-Year Source: Tuition & Fees = College Board, Annual Survey of Colleges; NCES, IPEDS Fall Enrollment data. Average tuition & fee prices reflect in-district charges for public two-year institutions & in-state charges for public four-year institutions. All figures in 2018 dollars. Debt = College Board, Annual Survey of Colleges; NCES, IPEDS Fall Enrollment data. Internet Trends Average tuition & fee prices reflect in-district charges for public two-year institutions & in-state charges for public four-year institutions. All figures in 2018 dollars. 235 2019
Post-Secondary Education Enrollment (USA) Internet Trends 236 2019
Offline Education Enrollment = Slowing Post-Secondary Education – Enrollments* Post-Secondary Students – % in Only Offline Courses 26MM 100% A US A , US es 74% , ts Cours 67% en m l ne i l f nrol 13MM f 50% O E te y nl O ng gradua i r ak T Unde ts en ud % St 0 0% 1970 1986 2002 2018 2012 2013 2014 2015 2016 2017 2 Year Undergraduate 4 Year Undergraduate Any Graduate Year = School Year Beginning in Fall Source: National Center for Education Statistics (3/18). 2017-2018 are estimates supplied by Chegg. *Note: Decline in Post-Secondary Students only taking offline courses partly driven by student demographics (e.g., an older student base more likely to be employed while at school). Data through 1995 are for institutions of higher education, while later data are for degree-granting institutions. Internet Trends Degree-granting institutions grant associate’s or higher degrees & participate in Title IV federal financial aid programs. The degree-granting classification is very similar to the earlier higher education 237 2019 classification, but it includes more 2-year colleges & excludes a few higher education institutions that did not grant degrees. Some data have been revised from previously published figures.
Online Education / Learning = Offline Institutions Expanding Reach Internet Trends 238 2019
Online Education Enrollment = High Across Diverse Base of Universities Top 50 USA Post-Secondary Online Enrollment Leaders (2017) Public Private – For Profit Private – Not For Profit Institution Enrollment Institution Enrollment Institution Enrollment University of Maryland 51K University of Phoenix – Arizona 129K Western Governors University 84K University of Central Florida 36 Grand Canyon University 69 Liberty University 68 Ivy Tech Community College 35 Walden University 53 Southern New Hampshire U. 64 Arizona State University 31 American Public University System 49 Excelsior College 42 University of Florida 31 Ashford University 41 Brigham Young University 36 Florida International University 30 Capella University 38 Ultimate Medical Academy 16 Lone Star College System 23 Kaplan University – Davenport 37 Embry-Riddle 13 University of South Florida 22 Colorado Technical University 25 National University California 13 University of Texas Arlington 21 Chamberlain College of Nursing 24 Columbia Southern University 23 Total Enrollment 336K Houston Community College 19 Full Sail University 21 Valencia College 18 DeVry University-Illinois 19 California State – Northridge 17 St Petersburg College 16 Total Enrollment 528K Texas Tech University 16 Penn State University – Main 16 College of Southern Nevada 15 Kent State University 15 Florida State University 15 University of Houston 15 University of Cincinnati 14 University of Illinois at U-C 14 Ohio State University – Main 14 Penn State University – World 13 University of North Texas 13 Utah State University 13 N. Virginia Community College 13 University of Arizona 13 Northern Arizona University 13 California State – Fullerton 13 Total Enrollment 576K Source: Babson Survey Research Group Grade Increase: Tracking Distance Education in the United States (2018) Internet Trends 239 2019
Online Education Courses = Top Offline Institutions Ramping Online Offerings Degree Programs @ Top Institutions Moving Online via Coursera 2016 2017 2018 2019 University of Illinois HEC Paris Arizona State University University of Pennsylvania Master of Business Administration MScof Innovation & Master of Computer Science Master of Computer Master of Computer Science Entrepreneurship Information & Technology University of Illinois University of London Master of Science in Accountancy Bachelor of Science in Computer Science Macquarie University Global MBA University of Michigan Master of Public Health Master of Applied Data Science Imperial College London Master of Public Health Master of Applied Data Science University of Colorado Boulder Master of Science in Electrical Engineering Source: Coursera (6/19). Note: Data reflects first year of program offering of active programs on Coursera. Internet Trends 240 2019
…Online Education / Learning Platforms = Scaling…Different Shapes & Sizes Internet Trends 241 2019
Online Education Program Managers = 2U 2U – Post-Secondary (USA) Online Graduate Programs Cumulative Classes Broadcast ds600K on 2Uan t us as ho oadc T Br es s as l C 300K ty i s er v ni U Why should you pick up your life, quit your job & move to e m attend school if you can get everything you would receive i T - normally from that experience over the Internet… l but not sacrifice either quality or the level of relationships – / Rea between students & faculty or students & fellow students. e v Li [You can] become a full member of that community, 0 getting the same degree & the same level of access. 2015 2016 2017 2018 2019 Christopher Paucek – Co-Founder & CEO 2U, 11/18 Source: Goldman Sachs Investment Research (5/18). Christopher Paucek Interview with Code (11/18). Internet Trends 242 2019
Online Education Marketplaces = Coursera… Coursera – Post-Secondary (Global) Top Courses, 2018 Learners 40MM Stanford Machine Learning Learning How to Learn: Powerful Mental Tools to s UC San Diego r Help You Master Tough Subjects e n r Yale a The Science of Well-Being e L Princeton d Bitcoin & Cryptocurrency Technologies e r te s Princeton i 20MM Algorithms, Part I g Re University of Pennsylvania English for Career Development Yale Financial Markets Introduction to Psychology University of Toronto Cómo Hacer una Tesis Universidad Nacional Autónoma de México Chinese for Beginners Peking University 0 2014 2015 2016 2017 2018 Learners by Geography 30% 28% 20% 11% 5% 0% 20% 40% 60% 80% 100% North America Asia Europe South America Africa Source: Coursera. Note: Course popularity based on average daily enrollments. Graph shows learners as of 12/18. Internet Trends 243 2019
…Online Education Marketplaces = Udemy Udemy –Continuing Education (Global) Education Marketplace Instructors + Students 200MM+ Enrollments in 100K+ Courses 32MM 50K ) ar) ne B Li ue l Red B ( ( 16MM 25K ts tors From day one, we wanted to create a destination en uc where anyone could learn skills to improve their tud tr life at an affordable price. S Ins Since most of our students learn in order to advance at work, we have also focused on building an enterprise solution with over 3,000 curated courses that focus on business-relevant skills. This has been one of the fastest-growing portions of our business, 0 0 with customers growing +13x since 2015. 2015 2016 2017 2018 Eren Bali – Co-Founder, Udemy, 5/19 Source: Udemy (5/19). Internet Trends 244 2019
Online Education (Post-Graduation Income Sharing) = Lambda School Lambda School – Post-Secondary (Global) Income Share Agreements Students 2K udents St hool Sc1K bda The traditional higher education model downloads the Lam financial risks to the students. Universities aren’t e v incentivized to help students succeed because tuition ti is paid up front. Not at Lambda School. Ac We only succeed when our students do – with our ISA model, students pay no tuition until they have landed a job earning $50K or more. By aligning the incentives of Lambda School 0 with those of the student, we eliminate the financial risk. 1/18 4/18 7/18 10/18 1/19 4/19 Ultimately, we help people with raw talent refine their skills & match them with great, high-paying careers they love. Austen Allred – Co-Founder & CEO, Lambda School, 6/19 Source: Lambda School (6/19). Internet Trends 245 2019
Online Education Learning Tools = Chegg… Chegg –Post-Secondary (USA) Subscription Education Support Services Subscribers 4MM s r be i r c s ub S 2MM es c i If you learn better by just walking through the steps, erv S if you learn better by asking questions, if you learn better by watching videos, we teach you that way. We are constantly expanding the way we can teach you & the subjects that we're available for, the speed in which we can get you the answer back, the format in which you can consume it. 0 Dan Rosensweig –CEO, Chegg, 2/19 2015 2016 2017 2018 Source: Chegg, Dan Rosensweig presenting @ Morgan Stanley Technology, Media, Telecom Conference (2/19). Internet Trends 246 2019
…Online Education Learning Tools = Quizlet… Quizlet – Consumer Learning (Global) Customizable Learning Tools Monthly Active Users 60MM s er s U e v ti Ac 30MM y We recognize that technological innovation will continue to Monthl evolve jobs of the future. Educators have the power to equip students with evergreen skills that will always be necessary in a career, like learning how to learn & fostering a sense of curiosity to take throughout life. Students can really benefit from teachers setting a precedent that ongoing learning is normal & healthy so that incoming employees are agile & able to take on whatever comes their way. 0 Matthew Glotzbach – CEO, Quizlet, 4/19 2014 2015 2016 2017 2018 Source: Quizlet eCampus News Interview (4/19). Internet Trends 247 2019
…Online Education Learning Tools = Remind Remind –K-12 + Post-Secondary (North America) Teacher-Student-Parent Communication Monthly Active Users 40MM ers Us e v ti c A y l 20MM nth Mo 0 2014 2015 2016 2017 2018 Source: Remind (6/19). Peak total monthly active users. Consists primarily of USA + Canada users. Internet Trends 248 2019
Online Education (Remote Video Chat) = VIPKid VIPKid – Students Age 4-15 (China) + Teachers (North America) Remote Language Instruction Students + Teachers 700K 600K Students s r he c ea T & ts en350K tud S d i K IP 200K V 70K Teachers 30K 0 2017 2018 2019 Source: VIPKid (3/19). Internet Trends 249 2019
Online Education (Virtual Classrooms) = Byju’s Byju’s – Students Age 9-17 (India) Video-Based Classes Paying Students 2MM ts en tud S1MM ng i ay P 0 3/16 3/17 3/18 3/19 Source: Byju’s (5/19). Internet Trends 250 2019
Online Learning (Broad-Based Video) = YouTube Educational Content YouTube Selected Education Channel Subscribers 4.5B Annual Hours of ‘How-To’ Video Viewership 10MM 9MM 200MM+ s Views on Booktuber Content r be i r 5MM c 5MM s ub S 59% Gen Z Users Cite YouTube as Preferred Learning Tool 0 Khan Smarter Asap TED- Crash Academy Every SCIENCE Ed Course Day 2013 2019 Source: Google / YouTube (5/19), Pearson / The Harris Poll Beyond Millennials: the Next Generation of Learners survey (8/18). Survey includes 2,587 USA respondents ages 14-40 years old. Note: Hours of ‘How-To’ videos are for the year 2017 and represent videos with ‘How-To’ in the Internet Trends title. Booktubers are content creators that share book reviews & discussion groups on YouTube. Views are cumulative. 251 2019
Online Education (Job-Relevant Skills)… Google = Certifications for In-Demand Jobs... ‘Grow With Google’ IT Support Professional Certificate Coursera = Cumulative Program Enrollments 120K $49 Monthly Cost of Coursera Program Courses 8 Months Average Time Needed to Complete Program 60K 10K+ Learners Who Have Received Financial Support from Google 0 3/18 6/18 9/18 12/18 3/19 Source: Coursera (6/19). Internet Trends 252 2019
…Online Education (Job-Relevant Skills)… Coursera = ~80% Revenue…Business / Tech / Data Science… Coursera Top Specializations, 2018 Consumer Learner Revenue by Course Domain, 2018 Data Science Technology 31% 25% Other Business 21% 23% Job-Relevant Skills, per Coursera* Source: Coursera (6/19) Internet Trends 253 2019
…Online Education (Job-Relevant Skills)… Skill Building = Increasingly Offered by Employers Coursera Enterprise Partners 2K s tner e Par s i pr1K a Enter er s our C 0 3/18 6/18 9/18 12/18 3/19 Source: Coursera (6/19). Note: a Coursera enterprise partner is a company engaged with Coursera to provide employee skillbuilding programs based on Coursera content Internet Trends 254 2019
Online Education = High Interest… Retention / Completion Rates Vary Internet Trends 255 2019
Online Learning (Massive Open Online Courses – MOOCs) = Strong Growth…Completion / Retention Rates Vary Coursera – Course Completion Rate, 2018 Non-Degree Consumer Enterprise Degree Consumer 100% 100% 100% 89% 50% 50% 50% 44% 50% 4% 0% Unpaid Paid 0% Enterprise 0% Paid Degree Free Paid Paid Paid Learners Learners Learners Learners Source: Coursera (6/19). Note: Completion rate refers to the number of students that finish a course vs. the number that began the course. Internet Trends 256 2019
Online Education = More Growth + More Users + More Choice… Lower Cost for Consumers Internet Trends 257 2019
Online Education Costs = Can Be Lower vs. Offline Arizona State University Online Education Programs / Tool Undergraduate Degree Tuition / Fees (4 Years) $160K $145K The key to lowering cost is the introduction of technology & new methods that help student success. The key to stimulating [this] innovation is to change the focus $80K of the culture at a university from the faculty to the students. $65K If you change the focus from faculty‐centric to student‐centric, $55K $55K you realize you need more tools to achieve certain objectives. At Arizona State, we need tools for active learning, adaptive learning (advising tools, artificial intelligence‐based simulation tools & gaming tools) all in addition to the faculty & advisors that we have. Innovation is absolutely essential when you start $0 thinking about the success of every student. Arizona Non- Arizona Non- Resident Resident Resident Resident Michael Crow – President, Arizona State University, 6/16 Offline Online Source: Arizona State University (5/19). Wiley Online Library Interview (6/16) Internet Trends 258 2019
IMMIGRATION = IMPORTANT TO USA TECHNOLOGY LEADERSHIP Internet Trends 259 2019
This is a modal window.
USA = 60% of Most Highly Valued Tech Companies Founded By… 1st or 2nd Generation Americans…1.9MM Employees, 2018 Immigrant Founders / Co-Founders of Top 25 USA Valued Public Tech Companies, Ranked by Market Capitalization Rank Company Mkt Cap LTM Rev Employees Founder / Co-Founder Generation ($B) ($B) (K) (1st or 2nd Gen Immigrant) 1 Microsoft $1,007B $122B 131K -- -- 2 Amazon 888 242 648 Jeff Bezos 2nd, Cuba 3 Apple 875 258 132 Steve Jobs 2nd, Syria 4 Alphabet / Google 741 142 99 Sergey Brin 1st, Russia 5 Facebook 495 59 36 Eduardo Saverin 1st, Brazil 6 Cisco 239 51 74 -- -- 7 Intel 206 71 107 --* -- 8 Oracle 182 40 137 Larry Ellison / 2nd, Russia / Bob Miner 2nd, Iran 9 Netflix 158 17 7 -- -- 10 Adobe 136 10 21 -- -- Max Levchin / 1st, Ukraine / 11 PayPal 134 16 22 Luke Nosek / 1st, Poland / Peter Thiel / 1st, Germany / Elon Musk*** 1st, South Africa 12 Salesforce 125 14 35 -- -- 13 IBM 118 79 351 Herman Hollerith 2nd, Germany 14 Texas Instruments 104 16 30 Cecil Green / 1st, UK / J. Erik Jonsson 2nd, Sweden 15 NVIDIA 89 11 13 Jensen Huang 1st, Taiwan 16 Qualcomm 84 21 35 Andrew Viterbi 1st, Italy 17 Booking.com 77 14 25 -- -- 18 Uber 75 12 22 Garrett Camp 1st, Canada 19 Automatic Data Processing 73 14 57 Henry Taub 2nd, Poland 20 VMware 69 9 23 Edouard Bugnion 1st, Switzerland 21 Intuit 67 7 9 -- -- 22 ServiceNow 51 3 8 -- -- 23 Workday 48 3 11 Aneel Bhusri 2nd, India 24 Micron 38 30 36 -- -- 25 Cognizant 36 16 282 Francisco D'Souza / 1st, India** / Kumar Mahadeva 1st, Sri Lanka Source: CapIQ as of 6/7/19. *While Andy Grove (from Hungary) is not a co-founder of Intel, he joined as COO on the day it was incorporated. **Francisco D’Souza is a person of Indian origin born in Kenya. ***Max Levchin / Luke Nosek / Peter Thiel’s startup Confinity merged with Elon Musk’s startup X.com to form PayPal in 3/00. Internet Trends 260 2019
USA = Many Highly Valued Private Tech Companies Founded By… 1st Generation Immigrants Company Founder / Country of Valuation Company Founder / Country of Valuation Co-Founder Origin ($B) Co-Founder Origin ($B) WeWork Adam Neumann Israel $47B Crowdstrike Dmitri Alperovitch Russia $3B SpaceX Elon Musk South Africa 31 Affirm Max Levchin Ukraine 3 John Collison Ali Ghodsi Sweden Stripe Ireland 23 Databricks Matei Zaharia Romania 3 Patrick Collison Ion Stoica Romania Palantir Peter Thiel Germany 21 Jiajun Zhu China Epic Games Mark Rein Canada 15 Nuro Dave Ferguson New Zealand 3 DoorDash Tony Xu China 13 Ankur Kothari India Wish Peter Szulczewski Canada 9 Automation Anywhere Mihir Shukla India 3 Danny Zhang Neeti Metha Shukia India Instacart Apoorva Mehta India 8 Rushabh Parm India Stewart Butterfield Canada Confluent Jun Rao China 3 Slack Russia 7 Neha Narkhede India Serguei Mourachov Roblox David Baszucki Canada 2 Cal Henderson UK Medallia Borge Hald Norway 2 UiPath* Daniel Dines Romania 7 Lime Toby Sun China 2 Marius Tirca Brad Bao Tanium David Hindawi Iraq 7 Zume Pizza Alex Garden Canada 2 David Helgason Iceland Gusto TomerLondon Israel 2 Unity Technologies Nicholas Francis Denmark 6 Lemonade Shai Wininger Israel 2 Germany Daniel Schreiber Joachim Ante LegalZoom Brian Lee South Korea 2 Robinhood Baiju Bhatt India 6 Al Goldstein Uzbekistan Vlad Tenev Bulgaria Avant John Sun China 2 Compass Ori Allon Israel 4 Paul Zhang China Credit Karma Kenneth Lin China 4 Apttus Krik Krappe UK 2 Adi Tatarko Postmates Bastian Lehmann Germany 2 Houzz Israel 4 Sprinklr Ragy Thomas India 2 Alon Cohen Cloudflare Michelle Zatlyn Canada 2 Marcin Zukowski Netherlands Carta Manu Kumar India 2 Snowflake Benoit Dageville France 4 ZocDoc Oliver Kharraz Germany 2 Thierry Cruanes France Warby Parker Dave Gilboa Sweden 2 Bipul Sinha India Carbon3D Alex Ermoshkin Russia 2 Arvind Nithrakashyap India Pony.ai James Peng China 2 Rubrik India 3 Tiancheng Lo Arvind Jain Ara Mahdessian Iran Soham Mazumdar India ServiceTitan VaheKuzoyan Armenia 2 Zoox Tim Kentley-Klay Australia 3 Segment Ilya Volodarsky Russia 2 Oscar Health Mario Schlosser Germany 3 Quanergy Tianyue Yu China 2 Source for Valuation & Founders Backgrounds: Based on analysis by Pitchbook, Wall Street Journal, CB Insights, Forbes, Business Insider, & the National Foundation for American Policy. *UiPath is headquartered in New York, NY but was originally founded in Romania. Internet Trends 261 2019
USA = 14% of Population Foreign-Born & Rising… Near All-Time High (1910) @ 15% USA Population vs. Foreign-Born % of Total Population 360MM 16% ) ) ea ne r Li A ey r Red G ( + l ota ue T l B 180MM 8% ( on ati orn % of ul B op - P gn A orei US F 0 0% 1907 1929 1951 1973 1995 2017 Foreign-Born Population USA-Born Population Foreign % Total Source: Migration Policy Institute (MPI) tabulation of data from U.S. Census Bureau, 2010-2017 American Community Surveys (ACS) & 1970, 1990 & 2000 Decennial Census. All other data are from Campbell J. Gibson & Emily Lennon, "Historical Census Statistics on the Foreign-Born Population of the United States: 1850 to 1990" (Working Paper no. 29., U.S. Census Bureau, Washington, DC, 1999). Note: The term "immigrants" (also Internet Trends known as the foreign born) refers to people residing in the United States who were not U.S. citizens at birth. This population includes naturalized citizens, lawful permanent residents (LPRs), certain legal nonimmigrants 262 2019 (e.g., persons on student or work visas), those admitted under refugee or asylee status & persons illegally residing in the United States. Population growth figures from St. Louis FRED database.
USA INC.* = WHERE YOUR TAX DOLLARS GO *USA, Inc. Full Report – bondcap.com/report/usa/ Internet Trends 263 2019
USA Income Statement = -18% Average Net Margin Over 30 Years USA Income Statement F1988 F1993 F1998 F2003 F2008 F2013 F2018 Comments Revenue ($B) $909 $1,154 $1,722 $1,782 $2,524 $2,775 $3,330 Y/Y Growth 6% 6% 9% (4%) (2%) 13% 0% +5% Y/Y average, 1988-2018 Individual Income Taxes* $401 $510 $829 $794 $1,146 $1,316 $1,684 Largest driver of revenue % of Revenue 44% 44% 48% 45% 45% 47% 51% Social Insurance Taxes $334 $428 $572 $713 $900 $948 $1,171 Social Security & Medicare payroll tax % of Revenue 37% 37% 33% 40% 36% 34% 35% Corporate Income Taxes* $95 $118 $189 $132 $304 $274 $205 Fluctuates with economic conditions % of Revenue 10% 10% 11% 7% 12% 10% 6% Other $79 $99 $133 $144 $174 $237 $271 Estate & gift taxes, duties / fees… % of Revenue 9% 9% 8% 8% 7% 9% 8% Expense ($B) $1,064 $1,409 $1,652 $2,160 $2,983 $3,455 $4,109 Y/Y Growth 6% 2% 3% 7% 9% (2%) 3% Entitlement / Mandatory $448 $671 $859 $1,182 $1,595 $2,032 $2,522 Risen owing to rising healthcare costs + % of Expense 42% 48% 52% 55% 53% 59% 61% aging population Non-Defense Discretionary $174 $247 $282 $419 $522 $577 $639 Education / law enforcement / % of Expense 16% 18% 17% 19% 18% 17% 16% transportation / general government… Defense $291 $292 $270 $405 $612 $626 $623 2008 increase driven by War on Terror % of Expense 27% 21% 16% 19% 21% 18% 15% Net Interest on Public Debt $152 $199 $241 $153 $253 $221 $325 Recent benefit of historic low interest rates % of Expense 14% 14% 15% 7% 8% 6% 8% Surplus / Deficit ($B) ($155) ($255) $69 ($378) ($459) ($680) ($779) -18% average net margin, 1988-2018 Net Margin (%) (17%) (22%) 4% (21%) (18%) (24%) (23%) Source: Congressional Budget Office, White House Office of Management & Budget. *Individual & corporate income taxes include capital gains taxes. Note: USA federal fiscal year ends in September. Non-defense discretionary Internet Trends includes federal spending on education, infrastructure, law enforcement, judiciary functions. 264 2019
…USA Income Statement = Net Loses in 45 of 50 Years USA Annual Profits & Losses $500B $0 s $0 os / L t i of r P Net -$500B l ua nn A A US -$1,000B -$1,500B 1969 1976 1983 1990 1997 2004 2011 2018 Source: Congressional Budget Office, White House Office of Management & Budget. Note: USA federal fiscal year ends in September. Internet Trends 265 2019
USA Entitlements = Medicare + Medicaid Driving Most Spending Growth… USA Entitlements by Category 1988 Entitlements* = 2018 Entitlements* = $367B / 34% of Expenses $2.2T / 54% of Expenses 30% 24% ts 20% en em tl nti E y 14% r 15% ato nd Ma 9% A 7% US 7% 3% 4% 0% Social Security Medicare Medicaid Income Security Medicare Medicaid 1988 2018 1988 2018 1988 2018 Source: Congressional Budget Office, White House Office of Management & Budget. *1988 Income Security programs defined as Food Stamps + SSI + Family Support + Child Nutrition + Earned Income Tax Credit + Other. 2018 Income Internet Trends Security defined as Earned Income Tax Credit + SNAP + SSI + Unemployment + Family Support + Child Nutrition. In 266 2019 2018, there was an additional ~$302B in mandatory spending, including Veterans’ pensions & ~$81B in 1988.
…USA Entitlements = 61% vs. 42% of Government Spending Thirty Years Ago USA Expenses by Category $1.1T $4.1T 100% 10% 14% 8% 1988 Æ2018 Change 16% 16% Debt* d +$14T (+668%) 15% el i Entitlements Y es y +$2.1T (+463%) ns ur eas pe 50% 27% 5% r x 61% T Non-Defense E Discretionary A 10Y US +$465B (+268%) SA U Defense 42% +$332B (+114%) Net Interest Cost: +$173B (+114%) 0% 0% 1988 2018 Entitlements / Mandatory Defense 10 Year Treasury Yield Non-Defense Discretionary Net Interest Cost Source: Congressional Budget Office, White House Office of Management & Budget, USA Treasury *Debt reflects net debt (i.e. excludes debt issued by The Treasury & owned by other Government accounts) Internet Trends Note: Yellow line represents yield on 10-year USA Treasury bill from 12/31/87 to 12/31/18. 267 2019
USA Entitlements Growth Over 30 Years = Looking @ Numbers…Closer to Home 2017… $61K = Median USA Household Income $17K = Average Entitlement Payout per Household from Federal Government… Scale = Equivalent to 28% of Household Income …1987 $26K = Median USA Household Income $4K = Average Entitlement Payout per Household from Federal Government… Scale = Equivalent to 15% of Household Income Source: Congressional Budget Office, White House Office of Management & Budget, US Census Bureau Internet Trends 268 2019
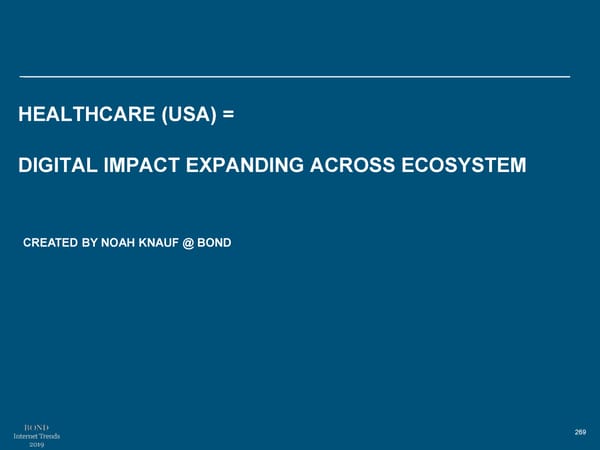
HEALTHCARE (USA) = DIGITAL IMPACT EXPANDING ACROSS ECOSYSTEM CREATED BY NOAH KNAUF @ BOND Internet Trends 269 2019
This is a modal window.
Healthcare Cost = High + Rising for Government / Consumers Health Expenditures – Health Expenditures – % of Government Total, USA % of GDP, 2017, per OECD 30% USUSAA SWITZERLAND FRANCE GERMANY ture) SWEDEN i JAPAN nd ) CANADA pe AUSTRIA x DP THE NETHERLANDS E G l BELGIUM ota % of GREAT BRITAIN T ( FINLAND % of15% nd AUSTRALIA pe NEW ZEALAND S ITALY ture ( th i SPAIN nd Heal GREECE pe CHILE x KOREA E th ISRAEL HUNGARY Heal IRELAND CZECH REPUBLIC POLAND MEXICO 0% TURKEY 1987 1992 1997 2002 2007 2012 2017 0% 10% 20% Total USA Government Federal Government State / Local Government Government / Compulsory Voluntary Source: USA Federal + State & Local Healthcare expenditures per the Center for Medicare / Medicaid Studies. Total USA Government expenditures per USA Bureau of Economic Analysis Data. Total Health expenditure per OECD data includes all public / private healthcare Internet Trends spend for the year 2017 (some data subject to future revision per OECD). 270 2019
Healthcare Insurance Coverage = Increasingly from Government vs. Employer % of Health-Insured Population, USA 360MM 7% A 7% US , s 39% arie 30% i c i 180MM ef en / B s ee l nrol E 63% 54% 0 2008 2009 2010 2011 2012 2013 2014 2015 2016 2017 Employer Government Out of Pocket Source: Kaiser Family Foundation analysis of Census Bureau's American Community Survey (2008-2017). Note: Government = Those Internet Trends covered by Medicare, Medicaid, or Military / Veteran Coverage. Employer = those covered through a current or former employer or union. 271 2019 Out of Pocket = Those covered by a policy purchased directly from an insurance company, either as policyholder or as dependent.
Healthcare Preventable Deaths / Efficiency = USA Worse vs. Peers Preventable Deaths per 100K People Administrative Healthcare Spend % Total, 2016 USA USA USA USA New Zealand Germany UK Switzerland Germany Netherlands Canada Australia Netherlands Canada Sweden Sweden Norway UK Australia 2004 Denmark 2014 France France Switzerland Japan 0 80 160 0% 3% 6% 9% Source: Commonwealth Fund Analysis (2017). Preventable deaths defined as deaths due to illnesses that are considered non-fatal with timely formal healthcare treatment, such as hepatitis, renal failure, thyroid disorder & other chronic illnesses. Administrative spend defined as non-care giving roles, such as billings & collections. Internet Trends 272 2019
Healthcare = Steadily Digitizing…Driven by Consumers Consumer Adoption of Digital Health Tools, USA Online Health Information Online Provider Reviews Mobile Tracking Wearables Live Video Telemedicine 2015 2018 0% 40% 80% % of Respondents, USA Source: Rock Health Digital Health Consumer Adoption Survey. 2018: n = 4,000, 2015: n = 4,017 Americans ages 18+. Internet Trends 273 2019
Healthcare (USA) = Strong Digital Usage / Adoption Internet Trends 274 2019
Data Pools = Unlocking Deeper Research Insights Internet Research = Increasing Access Genomic Testing = Growing Base to Data / Decision-Making Tools of Personal Genetic Data Annual Consumer Genomics Tests Patient engagement in decision-making has Conducted on Illumina Equipment, Global 14MM been associated with increased patient satisfaction & improved health outcomes The study analyzed cross-sectional data from ts 1,945 participants of the [USA] National es T Health & Aging Trends Study c i om Internet use was found to be associated with en 7MM active decision-making preference in older G adults. Similarly, health-related Internet use was positively associated with decision- making involvement in older adults. Cajita, Whitehouse, et al. Association Between Internet Use & Decision-Making 0 Preference in Older Adults (2/17) 2012 2014 2016 2018 Source: Illumina @ JPMorgan Healthcare conference (1/18). National Center for Biotechnology Information (USA, 2/17) Internet Trends 275 2019
Electronic Health Records (EHR) = Organizing Patient Data …EHR Usage = Still Early Innings EHR Adoption = Nearing 100%… Top Physician ‘Wants’ for Future EHR EHR Adoption, USA Development, per Stanford / Harris Poll, 9/18 100% Interoperability 67% m te s y S Predictive R. 50% Analytics 43% .H. E g % Usin Financial / Cost 32% Data Integration 0% 2004 2006 2008 2010 2012 2014 2016 0% 40% 80% Hospitals Physician’s Offices Source: Office for National Coordination of Health Information Technology. Stanford / Harris poll of 521 Primary Care physicians in USA (Family Internet Trends Practice, General Practice, or Internal Medicine) recruited through the American Medical Association. All have been using EHR for at least 1 month 276 2019 Note: Adoption of EHR refers to any EHR system being used by Office-based physicians or hospitals, does not imply all records are kept electronically.
Health Networks = Aligning Provider Teams Across Organizations Aligned Care Teams = Collective Medical = Improving Outcomes @ Lower Cost Real-Time Collaborative Health Network Network Growth + Patient Impact We strive to empower a distributed care team 60MM 1.4MM to act with aligned purpose, aware of what each individual member is doing – ar) B ) even if representing differing organizations – ne ue Li all united by their shared stewardship l B ( Red for the patient. A ( , US A ts 30MM 0.7MM i , US You can either throw a tremendous number s i ts V gh of expensive, scarce bodies at the problem ute i –which isn’t scalable – or you can use c Ins A e e v technology. I’m not talking about mere v ti ti ec ec l notifications that an encounter has l Col occurred, which we also do, but a deeper Col level of collaboration. 0 0 Chris Klomp – CEO, Collective Medical, 6/19 Acute Visits Insights Source: Collective Medical Technologies Inc. (6/19). *2019E represents annualized data as of 6/19. Note: Acute Visits = Internet Trends Patient-Provider interactions (ED visit, IP stay). Insights = Unique provider-provider actions taken to optimize patient care 277 2019
Online Discovery = Improving Accessibility + Availability of Care Optimizing Perishable Inventory = Zocdoc= Accelerating Access to Care Digital Healthcare Marketplace ZocdocMonthly Patients, USA Healthcare providers partner with 8MM Zocdocto fill their 20-30% unused, perishable inventory. This dramatically accelerates access to A care for patients. , US While patients who call wait an average of 24 ts en days to get in to see a doctor, when booking ati P 4MM y online via Zocdoc, the typical appointment l happens within 24-72 hours. nth Mo Because of this win/win, in our first market c NYC, one in five new patient-doctor do oc relationships is established via Zocdoc. Z Our other markets are following the same trajectory. 0 2012 2013 2014 2015 2016 2017 Oliver Kharraz M.D. – CEO / Founder, Zocdoc, 6/19 Source: Zocdoc (6/17, 6/19) Internet Trends 278 2019
On-Demand Urgent Care = Reducing Time to Receive Treatment On-Demand Access = Solv = Combining Convenience + Speed Convenient Care Marketplace Cumulative Medical Billings Saved, USA No longer are patients okay with waiting 160MM as many as 24 days to see a doctor. A US d, Solv is putting patients in front of a e v provider who can treat their a S symptoms in as little as 15 minutes. s ng The benefit this provides li Bil consumers is real. l 80MM dica e M We’ve already given ~20 years back to e iv consumers who typically spend 2 hours t between booking an appointment & getting la their issue resolved. Cumu olv S Heather Fernandez – CEO / Co-Founder, Solv, 6/19 0 2017 2018 2019 Source: Solv (6/19, 6/17-5/19). Note: Medical Bills Saved = Online appointments scheduled through Solv multiplied by 14% (Proportion of patient reported would have gone to the Internet Trends ER multiplied by $800 net savings…ER $1,000 vs urgent care $200). Savings could either be out of pocket for consumers or split between the consumer and insurance company. 279 2019
Telehealth / Telemedicine = Strengthening Patient <> Practitioner Relationships Telehealth Systems = Teladoc = Increasing Hospital Implementation Remote Medical Care Telehealth System Adoption, USA Teladoc Visits, Global 80% 3.0MM A US , s tem s al y S ob l th G l , ea ts i 40% s 1.5MM eh i el V T th th l i ea w eh s el tal T pi Hos % of 0% 0 2010 2011 2012 2013 2014 2015 2016 2017 2014 2015 2016 2017 2018 Source: American Hospital Association Fact Sheet: Telehealth (2/19), Teladoc SEC Filings. Internet Trends 280 2019
Prescription Delivery = Improving Convenience + Affordability Prescription Drug Expenditures = Nurx = Rapidly Rising On-Demand Drug Delivery Prescription Drug Expenditures, USA NurxMonthly Medical Interactions, USA $400B 300K A US A , US , tures s i on nd ti pe x erac E $200B Int 150K ug al Dr c on di pti Me i x r c Nur es r P $0 0 1960 1970 1980 1990 2000 2010 2018 2016 2017 2018 2019 Source: Centers for Medicare & Medicaid Services (CMS) National Health Expenditures Internet Trends (5/19), Nurx (5/19). Note: Medical Interactions = medical questions & ongoing fulfillment 281 2019
Communication / Professional Community = Extending Knowledge Base to Practitioners Communication = Increasing Ability Doximity = to Address Unique Cases Physician Social Network [A patient] was bitten by a Macaque Doximity Registered Members monkey & as a result, came down with a 1.2MM rare form of encephalitis. A potentially fatal brain inflammation. His physician used al Doximity to find one of the rare specialist ob l who could treat this condition. G , s r There are only about 20 doctors in the be em entire U.S. that are expert in this area. 0.6MM The patient was referred & treated tered M successfully. s Regi ty i m Most people don’t realize that referring i patients to the appropriate specialist isn’t Dox always easy for physicians & our network makes that process seamless, even in the toughest cases. 0 2011 2013 2015 2017 Jeff Tangney – CEO / Co-Founder, Doximity, 12/17 Source: Doximity (5/19), Thrive Global (12/17). Members include physicians, physician assistants, nurse practitioners & medical students. Internet Trends 282 2019
Health Insurance Management = Simplifying + Centralizing User Experience Modernized Management = Oscar = Re-Imagining Legacy Systems Digital Health Management Oscar Memberships, USA 300K We have our own claims system we’ve been building, we have our own clinical management system, we built our networks ourselves – pretty much A everything that we do internally to manage US people’s healthcare was reinvented & , ps rebuilt from a technology perspective & so hi s r 150K that’s what we can now go faster toward. be m Me We can hire more engineers, we can hire ar c s more data scientists, more product designers, O more smart clinicians who can think about health care a different way. Mario Schlosser – CEO / Co-Founder, Oscar Health, 8/18 0 2014 2015 2016 2017 2018 Source: Oscar Health, Mario Schlosser Interview with Wired (8/18). Note: Oscar data as of the first month of each year based on enrollments timing. Internet Trends 283 2019
Health Incentive Tools = Driving Positive Choices via Savings + Personalized Rewards Rewards = Building + Reinforcing Rally Health = Positive Habits Incentivizing Healthy Living Rally Health Cumulative Incentives $1.6B A , US es v ti en nc e I v $0.8B ati ul Cum th Heal y l Ral $0 2015 2016 2017 2018 2019 Source: Rally Health / UnitedHealth Group (6/19) Internet Trends 284 2019
Medicare Plan Management = Personalizing Coverage + Costs Medicare Advantage Enrollments = Clover Health = On the Rise Matching Plans with Members’ Needs Medicare Advantage Enrollment, USA Clover Health Members, USA 22MM 40K A A t, US US , s en r m be l m nrol Me E 11MM e 20K e tag tag an an dv dv A A are are c c di di Me Me 0 0 1999 2004 2009 2014 2018 2015 2016 2017 2018 2019 Source: Kaiser Family Foundation analysis of CMS Medicare Advantage enrollment files (2008-2018) & MPR numbers (1999-2007) from March of Internet Trends the respective year, with the exception of 2006, which is from April (11/18). Clover Health (3/19). Note: Enrollment includes cost plans & Medicare 285 2019 Advantage Plans. Approximately 61MM people are enrolled in Medicare in 2018.
Healthcare Innovation = Internet Leaders Building Capabilities Internet Trends 286 2019
Healthcare Innovation = Internet Leaders Poised to Capture Data Internet Leaders = Increasingly Trusted with Healthcare Data With which tech company would you share your health data?* Google 60% Amazon 53% Microsoft 51% Apple 49% Samsung 46% Facebook 40% IBM 34% 0% 45% 90% % of Respondents, USA, 2018 Source: Rock Health Digital Health Consumer Adoption Survey. 2018: n = 4,000. *Note this question was only asked to the 11% of total respondents that answered ‘yes’ to the question asking whether they’d be willing to share their health data with a tech company. Internet Trends 287 2019
Healthcare Innovation = Apple… Hardware + App Store Leveraging Research For Consumers Apple = Democratization of Healthcare Apple ResearchKit = Medical Research Technology for Consumers If you zoom out into the future & you look back, & you ask the question, ‘What was Apple’s greatest contribution to mankind,’ it will be about health. Because our business has always been about enriching people’s lives. We’ve gotten into healthcare more & more through the Watch, other features created with ResearchKit & CareKit & including medical records on the iPhone. This a huge deal. [Healthcare] is very important for people. We are democratizing it. We are taking what has been with the institution & empowering the individual to manage their health. We’re just at the front end of this. Tim Cook – CEO, Apple, 1/19 Source: Apple. Tim Cook Interview with CNBC (1/19). Morgan Stanley estimates that 70MM Apple Watch units have been sold from 4/15-3/19. Internet Trends 288 2019
Healthcare Innovation = Google / Alphabet… Artificial Intelligence Unlocking Insights for Practitioners Google = DeepMind Streams = AI Enabled Healthcare AI Assistant for Doctors + Nurses If AI can shape healthcare, it has to work through the regulations of healthcare. In fact I see that as one of the biggest areas where the benefits will play out for the next 10-20 years. We had recently done work on diabetic retinopathy, it's a cause for blindness, but using AI machine learning we can detect it much better than humans can. Sundar Pichai – CEO, Google, 10/17 Source: DeepMind (11/18), Google. Sundar Pichai Interview with NDTV (10/17). Internet Trends 289 2019
Healthcare Innovation = Microsoft Healthcare… Enabling Healthcare’s Move to the Cloud with AI Solutions Microsoft = Microsoft Health Bot = Intelligent Healthcare Troubleshooting Health Issues The healthcare industry has made great strides over the last decade in helping digitize healthcare & so the next ten will be about turning those assets into better health insights, experiences & outcomes. This is where we can make a big contribution. Cloud, AI & research capabilities will play a fundamental role towards the future. At Microsoft, we’re continuing to learn & grow every day from the extensive set of partnerships that we have had in healthcare: over 168,000 healthcare organizations in 140 countries. Health & wellbeing are central to our daily lives. New inventions developed with our partners using Microsoft AI & machine learning can create a better future & make healthcare delivery more personal, affordable & accessible. Peter Lee – CVP, Microsoft Healthcare, 4/19 Source: Microsoft Industry Blog (4/19) Internet Trends 290 2019
Healthcare Innovation = Amazon / PillPack… Consumer-Centric Approach to Medication Management PillPack = Consumable Healthcare Prescription Medicine Usage = Increasingly Common Prescription Medicine Usage, 2019, USA 1-3 prescription drugs 37% 62% Take Prescription Drugs >4 prescription drugs 24% PillPack is meaningfully improving its customers’ lives & we want to help them continue making it easy for people to save Do not take time, simplify their lives, & feel healthier. Do not take prescription 38% perscription medicine medicine We’re excited to see what we can do together on behalf of customers over time. 0% 30% 60% Jeff Wilke – CEO, Amazon Worldwide Consumer, 7/18 % of Respondents, USA Source: Kaiser Family Foundation Health Tracking Poll (2/19). Survey of 1,400 USA adults over the age of 18, including 606 over the age of 65, conducted from 2/14-2/19/19. Respondents were asked the question: ‘Do you currently take any Internet Trends prescription medicine or not? IF YES: How many different prescription drugs do you take?’. PillPack press release (7/18). 291 2019
Healthcare Cost = High + Rising for Government / Consumers Health Expenditures Health Expenditures, % of Government Total, USA % of GDP, 2017, per OECD 30% USUSAA SWITZERLAND FRANCE GERMANY ture) SWEDEN i JAPAN nd ) CANADA pe AUSTRIA x DP THE NETHERLANDS E G l BELGIUM ota % of GREAT BRITAIN T ( FINLAND % of15% nd AUSTRALIA pe NEW ZEALAND S ITALY ture ( th i SPAIN nd Heal GREECE pe CHILE x KOREA E th ISRAEL HUNGARY Heal IRELAND CZECH REPUBLIC POLAND MEXICO 0% TURKEY 1987 1992 1997 2002 2007 2012 2017 0% 10% 20% Total USA Government Federal Government State / Local Government Government / Compulsory Voluntary Source: USA Federal + State & Local Healthcare expenditures per the Center for Medicare / Medicaid Studies. Total USA Government expenditures per USA Bureau of Economic Analysis Data. Total Health expenditure per OECD data includes all public / private healthcare Internet Trends spend for the year 2017 (some data subject to future revision per OECD). 292 2019
CHINA INTERNET = INNOVATIVE PRODUCTS + BUSINESSES CONTINUE TO IMPRESS PREPARED BY HILLHOUSE CAPITAL Disclaimer – The information provided in the following 39 slides is for informational & illustrative purposes only. No representation or warranty, express or implied, is given & no responsibility or liability is accepted by any person with respect to the accuracy, reliability, correctness or completeness of this Information or its contents or any oral or written communication in connection with it. Hillhouse Capital may hold equity stakes in companies mentioned in this section. A business relationship, arrangement, or contract by or among any of the businesses described herein may Internet Trends not exist at all & should not be implied or assumed from the information provided. The information provided herein by Hillhouse Capital does not constitute an offer to sell or a solicitation of an 293 2019 offer to buy, & may not be relied upon in connection with the purchase or sale of, any security or interest offered, sponsored, or managed by Hillhouse Capital or its affiliates.
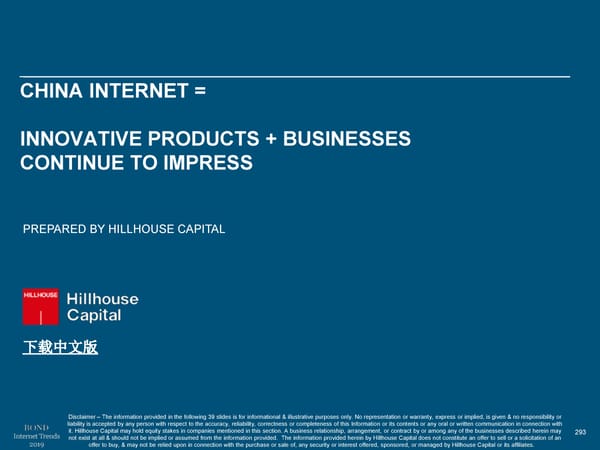

This is a modal window.
China Macro Trends Internet Trends 294 2019
China Near-Term Business Confidence = Fluctuating… China PMI Business Index + Enterprise Confidence Index (%) 63 80 % on i tat c % pe x ey E s urv s S ne i al 55 60 i us tr B us & on C Ind ti O uc B od P r P MI: P 47 40 2013 2014 2014 2015 2016 2017 2018 2019 PMI: Production and Business Expectation (LS) PBOC Industrial Survey: Enterprise Confidence (RS) Source: CEIC, Morgan Stanley Research Internet Trends 295 2019
…China Near-Term Consumer Confidence = Fluctuating China Consumer Confidence Proxy Based on Average Z-Score* of Household Loans, Consumer Confidence Index, Passenger Car Sales, Air Passenger Traffic & Catering Consumption 3 na Chi , y ox r P e nc de i 0 Conf er um Cons -3 12/11 6/12 12/12 6/13 12/13 6/14 12/14 6/15 12/15 6/16 12/16 6/17 12/17 6/18 12/18 Source: CEIC, Morgan Stanley Research. *A z-score measures how many standard deviations above or below the historical average a data point is. Internet Trends 296 2019
China Service Sector = Continues to Drive Economic Growth China Service Sector Output as % of Nominal GDP 60% na Chi , 30% DP G % of 0% 1968 1973 1978 1983 1988 1993 1998 2003 2008 2013 2018 Source: China National Bureau of Statistics, Morgan Stanley Research Note: Service sector defined as all industries outside of agriculture, forestry, animal husbandry & fishery industries (except support Internet Trends services to agriculture, forestry, animal husbandry & fishery industries), mining (except auxiliary activities of mining), manufacturing 297 2019 (except repairs for metal products, machinery & equipment), production & supply of electricity, steam, gas, water, & construction.
China Urbanization = Rising Rapidly…Room to Grow Urban Population – % Total Population 100% on ati ul op P50% l ota T % of 0% 1950 1967 1984 2001 2018 USA Japan Korea India China Source: CEIC, UN, Morgan Stanley Research Internet Trends 298 2019
China Urban Disposable Income Per Capita = Solid +8% Y/Y China Urban Disposable Income per Capita + Y/Y Growth ) $6,000 26% r a B e u l B ) ($, ta ne i p Li Ca r Red e ( p $3,000 13% th e m ow o r c G n I /Y e l Y b a s o p s Di n Urba $0 0% Urban Disposable Income per Capita Y/Y Growth Source: CEIC, assumes constant exchange rate of 1USD = 6.9RMB. Internet Trends 299 2019
China Trade Balance = Current Account Surplus Narrowing… Rising Outbound Tourism Offsetting Decreasing Net Exports China Current Account Balance 12% 8% na , Chi4% DP G % of 0% -4% 2002 2004 2006 2008 2010 2012 2014 2016 2018 Income & Transfer Service Balance Goods Balance Current Account Balance Source: SAFE, Morgan Stanley Research Internet Trends 300 2019
China Share of World Exports = Declining Since 2016 Due to Rising Wages + Aging Labor Force China Share of World Exports (%) 16% na %, Chi ts r po x E 8% d l r o W f e o r ha S 0% 2000 2001 2003 2004 2006 2007 2009 2010 2012 2013 2015 2016 2018 12M Trailing Sum 3M Trailing Sum Source: Haver Analytics, Morgan Stanley Research Internet Trends 301 2019
China Internet User / Usage Trends = Robust Usage Growth Primarily Driven by Short-Form Video Internet Trends 302 2019
China Mobile Internet Users = 817MM…+9% vs. +8% Y/Y China Mobile Internet Users vs. Y/Y Growth 1000MM 80% na , Chi ers /Y Y Us 500MM 40% th, ow ernet r Int G e l bi Mo 0 0% 2008 2009 2010 2011 2012 2013 2014 2015 2016 2017 2018 China Mobile Internet Users Y/Y Growth Source: China Internet Network Information Center Note: Mobile Internet User Data is as of Year-End. Internet Trends 303 2019
China Mobile Internet Usage (Data) = Continues to Accelerate +189% vs. +162% Y/Y China Cellular Internet Data Usage & Growth Y/Y 80EB 240% te) y ab x E = B E /Y ( Y na40EB 120% Chi th, ow e, r ag G Us Data e l bi Mo 0 0% 2012 2013 2014 2015 2016 2017 2018 China Mobile Data Consumption Y/Y Growth Source: China Ministry of Industry & Information Technology. Note: Cellular Internet Refers to 3G/4G Network data. Internet Trends 304 2019
China Short-Form Video = Leading User + Usage Growth Across All App Categories China Short-Form Video – Daily Time Spent Leading Short-Form Video Platforms – DAUs 600MM 250MM nt pe ers S Us e Hours300MM v 125MM ti e c l A bi y Mo l Dai y l Dai 0 0 2017-04 2018-04 2019-04 4/17 4/18 4/19 4/17 4/18 4/19 2017-04 2018-04 2019-04 Douyin Kuaishou Haokan Source: QuestMobile (4/19). Note: Short-Form Form Videos are typically <5 Minute in Length & include companies such as Kuaishou, Douyin, Baidu Haokan,etc Internet Trends 305 2019
China Short-Form Video = Driving Incremental Mobile Time Spent Growth Average Smartphone Time Spent per MAU per Month 150 Mobile Short Form Video Other Finance th Reading n o M r Music e p r e 75 Shopping Us r e p News s r u Ho Games Online Video Browser, Input Method, App Store 0 Communication & Social Networking Source: QuestMobile (4/19) Internet Trends 306 2019
China Innovation = Games Driving Transformation of… Payments / E-Commerce / Retail / Education Internet Trends 307 2019
WeChat Jump Jump= Simple Game Helped Create Ecosystem of Mini-Programs Uniqlo Pinduoduo Tongcheng-Elong Brand eCommerce Travel Booking Tiao yi tiao (Jump Jump) ~3x Conversion vs. Industry 89MM+ MAUs 169MM+ MAUs First Mini-Program Game 100MM+ DAUs in two weeks WeSing QR Code Xiaoniangao Entertainment Public Transit Photos 73MM+ MAUs 48MM+ MAUs 214MM+ MAUs Source: WeChat Open Class PRO 2019(01/19), Tencent Global Digital Ecosystem Summit(05/19), MAU per QuestMobile Mini-Programs 4/19. Internet Trends 308 2019
Alipay Ant Forest = Gamified Philanthropy Can Drive Consumer Engagement Ant Forest Accumulate green energy points by Protect your virtual tree Ant Financial & other charity completing tasks that reduce green energy points or partners turn virtual tree carbon emission or paper waste ‘collect’ friends’ points by green energy points into (walking / biking / public transit / waking up early & real trees to combat online & offline payment / checking in often deforestation recycling / used goods…) 500MM Cumulative Users of Ant Forest* within Alipay 100MM Real Trees Planted* ~4x Average Alipay Sessions per User per Day** Source: *Ant Financial as of 4/19, **QuestMobile as of 4/19. Internet Trends 309 2019
Pinduoduo = Group Buying… Social Shopping + Gamified Discounts Drive Growth Pinduoduo Trailing 12-Month GMV Get Cheaper Price by Friends Can Play Game & $100B Sharing with Friends Help Reduce Prices ) $B ( MV $50B G 0 Q1:17 Q3:17 Q1:18 Q3:18 Q1:19 Note: Assume FX 1USD=6.9RMB. Internet Trends 310 2019
Belle / TopSports = Digitization + Gamification Can Drive Same-Store-Sales Lift Belle / TopSports Store Managers Store Associates Real-time Sales by Employee KPIs & Gamified Rewards to Competitive Sales Category & SKU Peer Rankings Complete KPIs Games vs. Peer Stores Source: Belle. Internet Trends 311 2019
Online Education = Structured Fun Games Drive Learning TAL (XRS) Online Coding Cat Cartoon + Students PK Turning Math Learning Into Games Games of Codes Enhanced Learning Experience Internet Trends 312 2019
China Innovation = Internet-Based Products + Business Models Internet Trends 313 2019
China Chat = Enabler of Transactions & Services Internet Trends 314 2019
WeChat Innovation = Evolution from Chat to Mini-Programs / Payments WeChat WeChat WeChat WeChat Public Account Mini-Programs Mini-Programs Integrated Payment Following Browsing Items Placing Order Finishing Payment 1 2 3 4 Internet Trends 315 2019
Global Rollouts = Kakao/ Line / Facebook Incorporate Transaction Features Kakao Line Instagram / WhatsApp Chat / Music / Payment / Chat / Payment / Chat / Shopping / Games / Transportation… Food / Coupons… Money Transfer… Internet Trends 316 2019
China Local Services = Becoming ‘Super Apps’ Internet Trends 317 2019
Meituan = From Group Buying to Super App… 30+ Services…412MM Annual Transacting Users, +26% Y/Y… MeituanMobile App Functions vs. Relevant US Peers Source: Company Material. Internet Trends 318 2019
…MeituanSuper App… Growing Consumer Engagement + Transaction Frequency Meituan# of Transactions per User per Year by Cohort Source: Meituan IPO prospectus Internet Trends 319 2019
Alipay = From Payments to Super App… 200K+ Mini-Programs…1B+ Users…70% Use 3+ Financial Services* Alipay Daily Active Users, China 300MM na Chi , 150MM Us DA 0 2017-4/1704 20418/18-04 20419/19-04 Source: China DAU per QuestMobile (4/19),* Categories of financial services provided by Internet Trends Ant Financial include payment, wealth management, financing, insurance & credit system. 320 2019
Global Rollouts = Grab / Rappi / Uber Incorporate ‘Super App’ Features Grab Rappi Uber Transport / Food / Food / Grocery / Transport + Food + Payment / Logistics… More… e-Bikes + Freight… Internet Trends 321 2019
China Retail = Online / Offline / Omni-Channel Internet Trends 322 2019
Live-Streaming + E-Commerce = Can Increase… Transparency + Interactivity + Influencer Engagement TaobaoLive Kuaishou MOGU $14B+ Live-Streaming GMV Live-Streaming Live-Streaming = 24% of GMV in 2018 Shopping 4x Repeat Purchase Rate Source: Alibaba, MOGU. Note: MOGU GMV for the year ended March 31, 2019 Internet Trends 323 2019
Various Online Grocery Retail Formats = Competing For Consumer Wallet Share Freshippo(Hema) / Miss Fresh / XingshengYouxuan/ Meituan/ 7Fresh … Dingdong Maicai/ SongshuPinpin/ Ele.me / Taoxianda / PupuShengxian… Dailuobo… JD Daojia… • Owned & operated stores • Order in app • Order in app or groupbuy • Order in app • Pick-up or delivery • 30min delivery to home in WeChat mini-programs • 30min delivery to home • Freshippo – 135+ stores • Owned & operated • Next day delivery to • Fulfilled by partner stores, inventory + fulfillment neighborhood sorting delivered by Meituan / station + self pick up Ele.me / Taoxianda /JD • Franchised community partner owner Internet Trends 324 2019
Alibaba ‘New Retail’ Strategy = Digitizing Various Offline Retail Verticals Freshippo / Hema Sun Art Suning JV Intime 135+ 470 Supermarkets Consumer Fashion & Grocery Stores Digitized Electronics Department Stores Easy Home Eleme & Koubei Tmall Store LingShouTong Home On-demand Delivery for Rural 1MM+ Mom-&-Pop Improvement 2,100+ Starbucks Stores Omni-Channel Stores Stores Digitized Source: Company Materials Internet Trends 325 2019
WeChat Groups & Mini-Programs = Improving Customer Relationship Management (CRM) for Retail Belle / TopSports WeChat Groups & Mini-Programs Scan QR Code in Receive Latest Receive Latest Purchase + Checkout Store to Join Product Info via Brand Info via via WeChat WeChat Group Sales Associates Public Accounts Mini Programs Source: Belle. Internet Trends 326 2019
Yonghui Superstores = Creating Digital Grocery Experience @ Offline Stores YonghuiSuperstores Home Delivery = 50% of Home Delivery Red Packets Shared ~15% of Sales Ordered via in Group Chats in Pilot Stores WeChat Mini-Program to Drive Engagement Source: Tencent Global Digital Ecosystem Summit (05/19) Internet Trends 327 2019
China Education = Spreading from Offline to Online Internet Trends 328 2019
China K-12 Education = Online Augmenting Offline Learning Experience Xueersi Online (TAL) Xueersi Shuangshi (TAL) Zuoyebang K-12 Live-streaming Online Lecturer + K-12 Homework Help Group Courses Offline Tutor / (take photos to get answer help) Teaching Assistant + Live-streaming Group Courses Internet Trends 329 2019
China Kids (Ages 3-10) Education = Increasing Online Platform Usage Outside of School Hours VIPKid Hetao Coding Code Mao English 1-on-1 & Coding Recorded Coding Live-streaming Small Group Live-Streaming Courses Courses Online Courses Internet Trends 330 2019
China Government Services = Online Access Rising Internet Trends 331 2019
WeChat Groups & Mini-Programs = Improving Customer Relationship Management (CRM) for Retail Belle / TopSports WeChat Groups & Mini-Programs Scan QR Code in Receive Latest Receive Latest Purchase + Checkout Store to Join Product Info via Brand Info via via WeChat WeChat Group Sales Associates Public Accounts Mini Programs Source: Belle. Internet Trends 332 2019
Disclaimer Bond is a global technology investment firm that supports visionary founders throughout their life cycle of innovation & growth. Bond’s founding partners have backed industry pioneers such as DocuSign, Peloton, Spotify, Square & Uber. This presentation, including the information contained herein, has been compiled for informational purposes only & does not constitute an offer to sell or a solicitation of an offer to purchase any security. Any such offer or solicitation shall only be made pursuant to the final offering documents related to such security. The presentation relies on data + insights from a wide range of sources, including public + private companies, market research firms + government agencies. We cite specific sources where data are public; the presentation is also informed by non-public information + insights. We disclaim any + all warranties, express or implied, with respect to the presentation. No presentation content should be construed as professional advice of any kind (including legal or investment advice). We publish the Internet Trends® report on an annual basis, but on occasion will highlight new insights. We may post updates, revisions, or clarifications on Bond’s website (www.bondcap.com). Bond owns significant equity positions in certain of the companies referenced in this presentation. Internet Trends 333 2019


Internet Trends 201 Mary Meeker June 11 @ Code 2019
This is a modal window.
Internet Trends 2019 Users 1 E-Commerce + Advertising 2 7 pages 19 pages Usage 3 Freemium Business Models 4 Growth 46 pages 18 pages Data 5 Usage 6 Work 7 Education 8 Growth Concerns 31 pages 44 pages 18 pages 15 pages Immigration + 9 Healthcare 10 China 11 USA Inc. (Provided by Hillhouse Capital) 6 pages 23 pages 35 pages
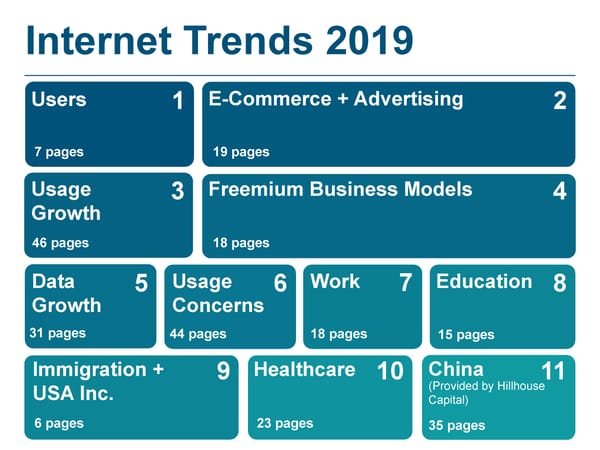
Thanks Bond Partners Michael Brogan & Ansel Parikh helped steer ideas & did a lot of heavy lifting. Noah Knauf, Collin Ebert, Jesse Ellingworth, Everett Randle, Nancy Xiao, Daegwon Chae, Paul Vronsky & Juliet de Baubigny also dug in & were more than on call with help. Hillhouse Capital Liang Wu & colleagues’ contribution of the China section provides an overview of the world’s largest market of Internet users. Participants in Evolution of Internet Connectivity From creators to consumers who keep us on our toes 24x7 & the people who directly help us prepare the report. And, Kara & team, thanks for continuing to do what you do so well. Internet Trends 3 2019
Context… We use data to tell stories of business-related trends we focus on. We hope others take the ideas, build on them & make them better. At 3.8B, the number of Internet users comprises more than half the world’s population. When markets reach mainstream, new growth is harder to find as evinced by declining new smartphone shipments in 2018. While E-Commerce continues to gain share vs. physical retail, growth rates are slowing. While Internet advertising growth is solid & innovation is healthy, there are areas where customer acquisition costs may be rising to unsustainable levels. While Internet user growth is slowing, global innovation & competition continue to drive product improvements, new types of usage & monetization – especially in areas of digital video, voice, wearables, on-demand + local services & traditionally underserved markets. Outside of USA, we focus on especially high growth & innovation in data-driven / direct fulfillment & financial services. We highlight massive global usage changes related to the evolution of images & interactive gaming as communications tools & the broad emergence of freemium businesses at scale. The rapid rise of gathered / analyzed digital data is often core to the holistic success of the fastest growing & most successful companies of our time around the world. Context-rich data can help businesses provide consumers with increasingly personalized products & services that can often be obtained at lower prices & delivered more efficiently. This, in turn, can drive higher customer satisfaction. Better data-driven tools can improve the ability for consumers to communicate directly & indirectly with businesses & regulators. Core constituents (consumers / businesses / regulators) are increasingly drinking from a data firehose & management challenges continue to rise for all parties. Broad awareness of challenges (& related vigorous / heated debates) can be the first step in driving change. Internet Trends 4 2019