The media could not be loaded, either because the server or network failed or because the format is not supported.
Beginning of dialog window. Escape will cancel and close the window.
End of dialog window.
A Complete Guide to Hub Analytics
Track how users interact with multiple content hubs. In 5 minutes, discover key indicators and use them to fine-tune your engagement strategy.
RELAYTO’s Hub Analytics isn’t just about tracking views and clicks; it’s about getting a clear picture of how your audience engages with your content. This guide will walk you through the key metrics, insights, and strategies to leverage RELAYTO’s analytics for maximum impact.
Overview
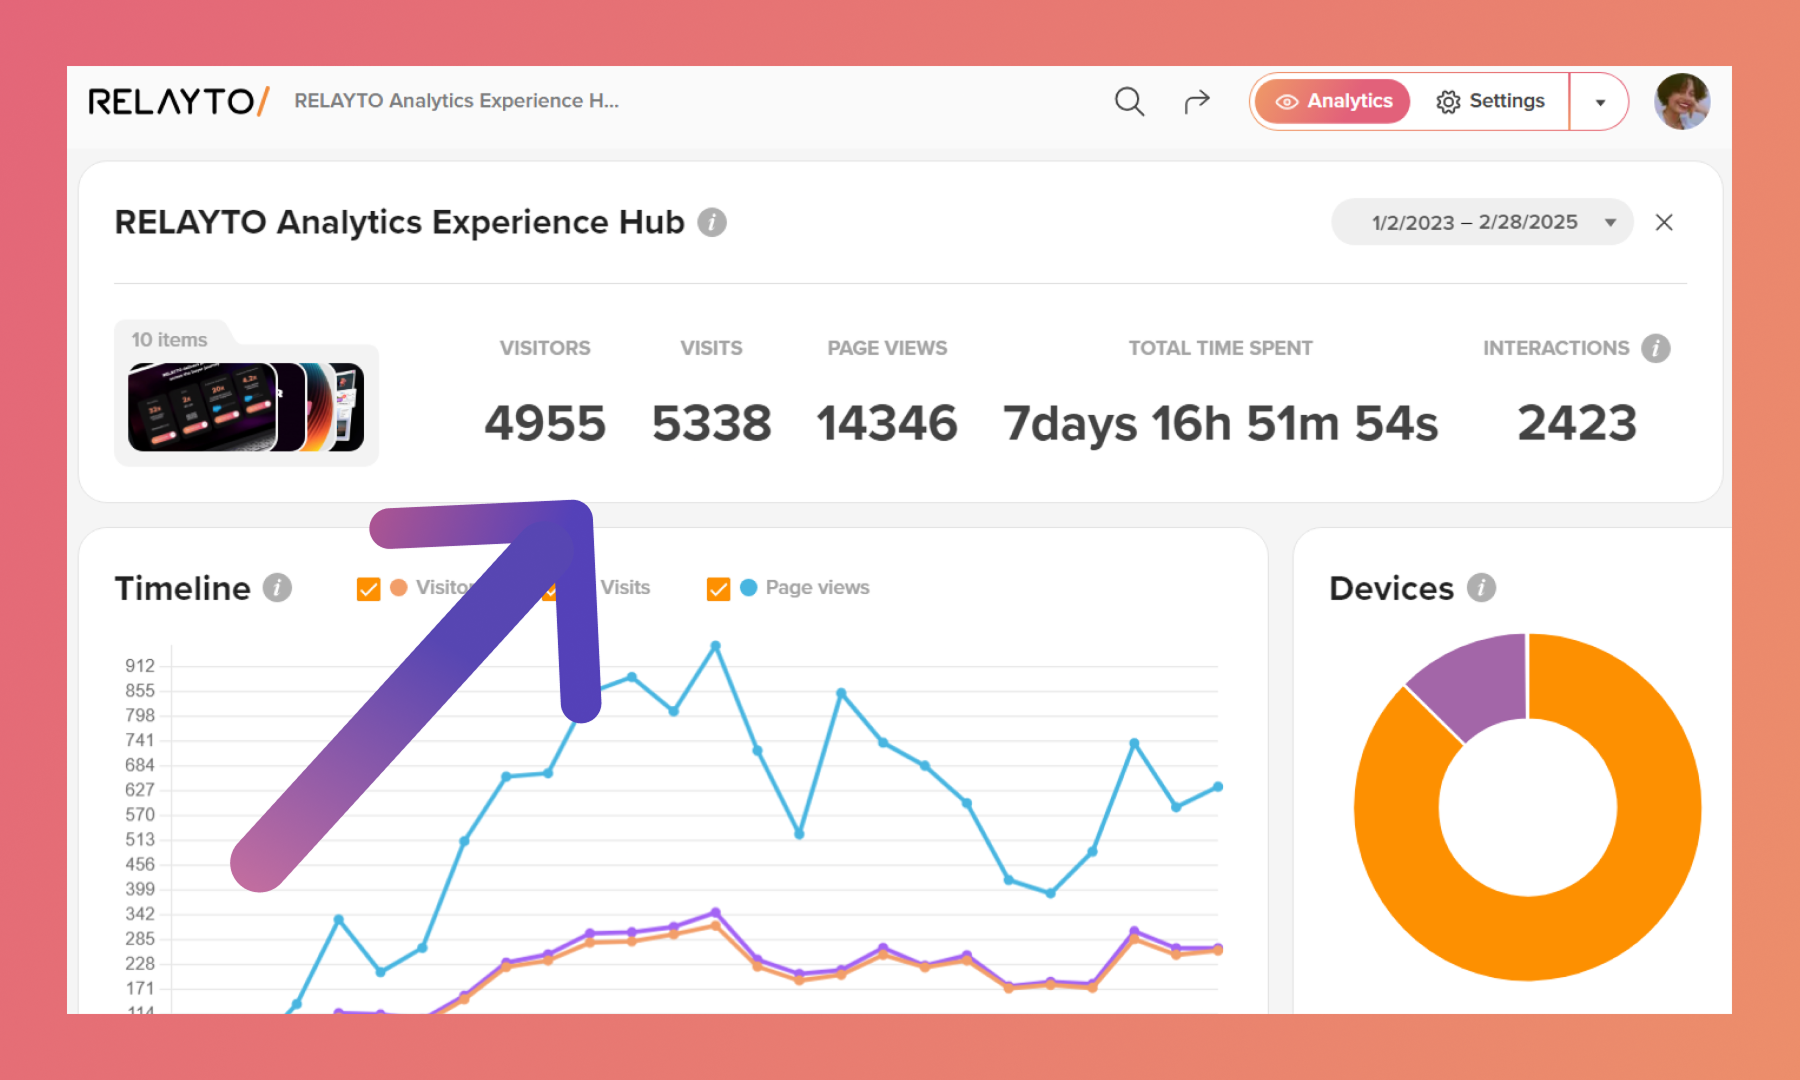
This section shows how viewers engage with the hub and its content. All data comes directly from the hub and the experiences within it. For example, page views include both visits to the hub page and views of any content accessed from it.
✅ How many people have visited the hub (Visitors) ✅ How many times those people have visited the hub (Visits) ✅ How many pages were viewed in total* (Page Views) ✅ Total time spent for all visitors (Total Time Spent) ✅ How many times people interacted with the hub (Interactions)
💡Tips: configure the time range by clicking on the data range in the top right corner:
Timeline
The Timeline section tracks viewer activity over time, showing when and how they engage with the hub and its content. It's the total number of visitors, visits, and clicks on CTAs in the content of the top-level hub and all sub-hubs in a given time interval.
💡Tips: Choose what category you want to exhibit by checking/unchecking the boxes:
Devices
The Devices section shows which devices viewers use to access the hub and its content. This includes data on desktops, tablets, and mobile devices, helping you optimize the experience for your audience's preferred platforms.
Locations
The Locations tab displays where your viewers are accessing the hub from. This helps you understand your audience’s geographic distribution and tailor content or outreach strategies accordingly.
Referrers
The Referrers tab shows where your viewers came from before landing on the hub. This includes traffic sources like search engines, social media, emails, or direct links, helping you identify which channels drive the most engagement.
Content
The Content tab tracks engagement with individual pieces of content within the hub. It shows metrics like views, time spent, and interactions, helping you understand which materials resonate most with your audience.
The "Hub page" tag indicates that the data comes from the hub itself, not the content within. This includes interactions with the main hub page and any sub-hubs, but not the individual experiences inside.
FAQ
What data is shown for content added in multiple sub-hubs?
If added to multiple sub-hubs, its metrics appear identical. The system aggregates engagement at the top hub level—a single pool of activity for that experience, regardless of the sub-hub. Sub-hubs don’t split the data because the system prioritizes a unified hub-wide view over tracking each access path separately.
Why don't aggregated numbers add up across metrics?
The list of contents shows visits and views for each item, so one session viewing multiple items counts as multiple visits and views. The Overview section counts visits and views for the entire hub—each session counts as one visit, reflecting total hub activity. The numbers differ because they measure specific content interaction versus overall traffic.
Why is there no data for a sub-hub page while the content within that sub-hub shows data?
This situation often occurs when your navigation for the top-level hub is configured. In such cases, visitors may go directly to content pages, bypassing the hub page.
💡 Tip: Unlock your content's potential. Analyse these engagement metrics to understand what resonates with your audience, optimise underperforming areas, and create a more impactful user experience.

.png)
.png)
.png)
.png)
.png)
.png)


