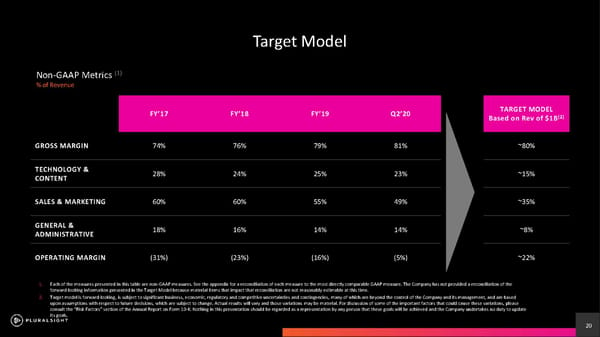
20 1. Each of the measures presented in this table are non - GAAP measures. See the appendix for a reconciliation of each measure to the most directly comparable GAAP measure. The Company has not provided a reconciliation of the forward - looking information presented in the Target Model because material items that impact that reconciliation are not reasona bly estimable at this time. 2. Target model is forward - looking, is subject to significant business, economic, regulatory and competitive uncertainties and cont ingencies, many of which are beyond the control of the Company and its management, and are based upon assumptions with respect to future decisions, which are subject to change. Actual results will vary and those variations ma y be material. For discussion of some of the important factors that could cause these variations, please consult the Risk Factors section of the Annual Report on Form 10 - K. Nothing in this presentation should be regarded as a repre sentation by any person that these goals will be achieved and the Company undertakes no duty to update its goals. FY17 FY18 FY19 Q220 TARGET MODEL Based on Rev of $1B (2) GROSS MARGIN 74% 76% 79% 81% ~80% TECHNOLOGY & CONTENT 28% 24% 25% 23% ~15% SALES & MARKETING 60% 60% 55% 49% ~35% GENERAL & ADMINISTRATIVE 18% 16% 14% 14% ~8% OPERATING MARGIN (31%) (23%) (16%) (5%) ~22% Target Model Non - GAAP Metrics (1) % of Revenue
 Pluralsight Investor Presentation Page 19 Page 21