
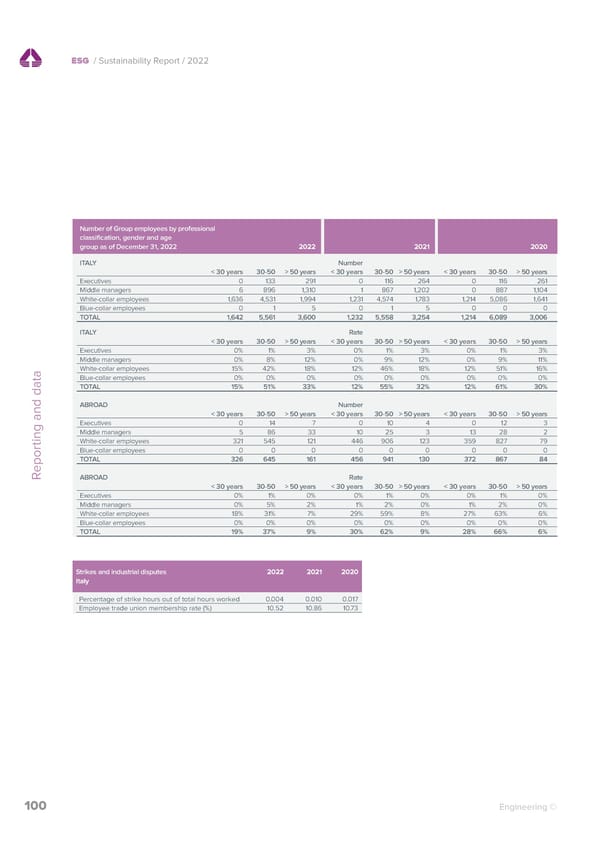
ESG / Sustainability Report / 2022 ESG / Sustainability Report / 2022 Number of Group employees by professional New hires and turnover MEN MEN WOMEN WOMEN TOTAL TOTAL classification, gender and age from January 1 to December 31 2022 2022 (%) 2022 2022 (%) 2022 2022 (%) group as of December 31, 2022 2022 2021 2020 ITALY ITALY Number < 30 years of age 632 8.6% 266 7.7% 898 8.3% < 30 years 30-50 > 50 years < 30 years 30-50 > 50 years < 30 years 30-50 > 50 years 30 - 50 years of age 554 7.5% 225 6.5% 779 7.2% Executives 0 133 291 0 116 264 0 116 261 > 50 years of age 95 1.3% 34 1.0% 129 1.2% Middle managers 6 896 1,310 1 867 1,202 0 887 1,104 Italy total 1,281 17.4% 525 15.2% 1,806 16.7% White-collar employees 1,636 4,531 1,994 1,231 4,574 1,783 1,214 5,086 1,641 ABROAD Blue-collar employees 0 1 5 0 1 5 0 0 0 < 30 years of age 196 19.2% 57 16.0% 253 14.5% TOTAL 1,642 5,561 3,600 1,232 5,558 3,254 1,214 6,089 3,006 30 - 50 years of age 185 18.1% 82 23.0% 267 15.3% ITALY Rate > 50 years of age 43 4.2% 0 0% 43 2.5% < 30 years 30-50 > 50 years < 30 years 30-50 > 50 years < 30 years 30-50 > 50 years Unavailable* - - - - 116 6,7% Executives 0% 1% 3% 0% 1% 3% 0% 1% 3% Abroad total 424 41.6% 139 39.0% 679 39.0% Middle managers 0% 8% 12% 0% 9% 12% 0% 9% 11% Grand Total 1,704 20.4% 661 17.4% 2,485 19.8% White-collar employees 15% 42% 18% 12% 46% 18% 12% 51% 16% * For 2022, for some employees of the Group’s foreign companies, it was possible to reconstruct only the overall Reporting and data Blue-collar employees 0% 0% 0% 0% 0% 0% 0% 0% 0% figure relating to the total number of employees hired, but not the detailed figure with the specification of gender and TOTAL 15% 51% 33% 12% 55% 32% 12% 61% 30% age group. The data provided consider exclusively those hired externally and those hired due to the acquisition of new companies. Furthermore, the data relating to the 2020 and 2021 two-year period are not provided as they were ABROAD Number unavailable. < 30 years 30-50 > 50 years < 30 years 30-50 > 50 years < 30 years 30-50 > 50 years Executives 0 14 7 0 10 4 0 12 3 Middle managers 5 86 33 10 25 3 13 28 2 Termination of employment and turnover MEN MEN WOMEN WOMEN TOTAL TOTAL White-collar employees 321 545 121 446 906 123 359 827 79 from January 1 to December 31 2022 2022 (%) 2022 2022 (%) 2022 2022 (%) Blue-collar employees 0 0 0 0 0 0 0 0 0 TOTAL 326 645 161 456 941 130 372 867 84 ITALY < 30 years of age 173 2.4% 65 1.9% 238 2.2% Reporting and data ABROAD Rate 30 - 50 years of age 442 6.0% 146 4.2% 588 5.4% < 30 years 30-50 > 50 years < 30 years 30-50 > 50 years < 30 years 30-50 > 50 years > 50 years of age 169 2.3% 52 1.5% 221 2.0% Executives 0% 1% 0% 0% 1% 0% 0% 1% 0% Italy total 784 10.7% 263 7.6% 1,047 9.7% Middle managers 0% 5% 2% 1% 2% 0% 1% 2% 0% White-collar employees 18% 31% 7% 29% 59% 8% 27% 63% 6% ABROAD Blue-collar employees 0% 0% 0% 0% 0% 0% 0% 0% 0% < 30 years of age 103 10.1% 28 7.9% 131 7.5% TOTAL 19% 37% 9% 30% 62% 9% 28% 66% 6% 30 - 50 years of age 140 13.7% 51 14.3% 191 11.0% > 50 years of age 43 4.2% 7 2.0% 50 2.9% Unavailable* - - - - 87 5.0% Abroad total 286 28.0% 86 24.2% 459 26.3% Grand Total 1,070 12.8% 349 9.2% 1,506 12.0% Strikes and industrial disputes 2022 2021 2020 Italy * For 2022, for some employees of the Group’s foreign companies, it was possible to reconstruct only the overall figure relating to the total number of terminated employees, but not the detailed figure with the specification of gender and Percentage of strike hours out of total hours worked 0.004 0.010 0.017 age group. To calculate the rates, the total of men, women and employees in their overall number (and not broken down Employee trade union membership rate (%) 10.52 10.86 10.73 by age group) was used in the ratio denominator. Furthermore, the data relating to the 2020 and 2021 two-year period are not provided as they were unavailable. Number of Group employees by professional classification as of December 31, 2022 - BeShaping Group 2022 ITALY Executives 105 Middle managers 221 White-collar employees 823 Blue-collar employees 1 Apprentices 45 Italy total 1,195 ABROAD Executives 74 Middle managers 0 White-collar employees 665 Blue-collar employees 0 Apprentices 0 Abroad total 739 BE Group TOTAL 1,934 100 Engineering © Engineering © 101
 2022 | ESG Report Page 99 Page 101