
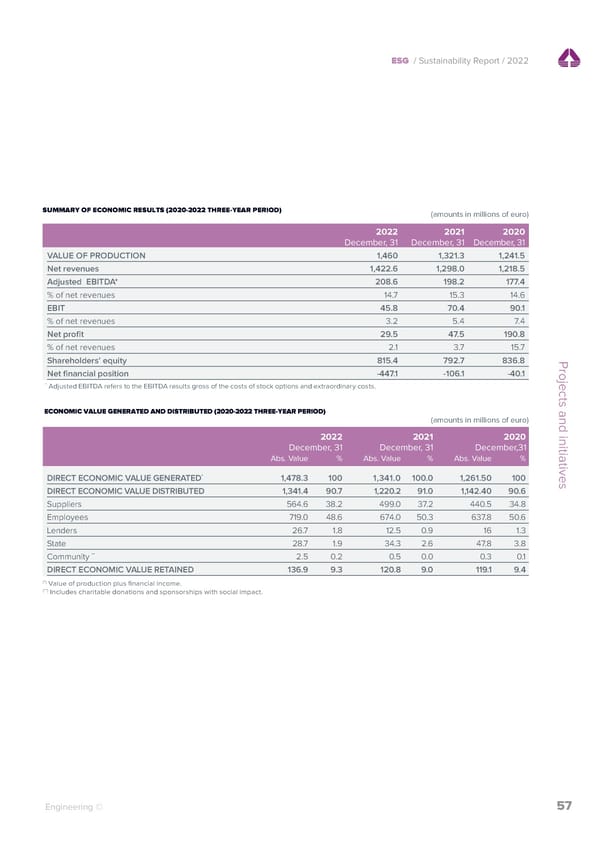
ESG / Sustainability Report / 2022 ESG / Sustainability Report / 2022 Economic value generated and distribuited HighlightsIn the course of 2022, the Group obtained a significant SUMMARY OF ECONOMIC RESULTS (2020-2022 THREE-YEAR PERIOD) (amounts in millions of euro) improvement in its profitability, in percentage as well as 2022 2021 2020 Revenues absolute terms, across all of the main indicators. December, 31 December, 31 December, 31 1,459 million euro VALUE OF PRODUCTION 1,460 1,321.3 1,241.5 The Group’s objective is definitely the creation of wealth for Net revenues 1,422.6 1,298.0 1,218.5 Economic value distributed its shareholders, employees and suppliers. The generation to stakeholders of well-being for the community and new wealth for the Adjusted EBITDA* 208.6 198.2 177.4 1,341.4 million eurocountry is no less important. As of December 31, 2022, the % of net revenues 14.7 15.3 14.6 direct economic value generated by the Group was 1,478 EBIT 45.8 70.4 90.1 Net profit million euro, of which 91% was distributed (1,341 million euro). % of net revenues 3.2 5.4 7.4 29.4 million euroThe share contributed to the State amounted to 28.7 million Net profit 29.5 47.5 190.8 euro (1.9% of the total direct economic value generated), % of net revenues 2.1 3.7 15.7 while the share distributed to the community, inclusive of Shareholders’ equity 815.4 792.7 836.8 Projects and initiatives membership fees and charitable contributions, amounted to Net financial position -447.1 -106.1 -40.1 2.5 million euro. These numbers confirm our commitment to * Adjusted EBITDA refers to the EBITDA results gross of the costs of stock options and extraordinary costs. generating well-being for the community and contributing to the country’s economy.ECONOMIC VALUE GENERATED AND DISTRIBUTED (2020-2022 THREE-YEAR PERIOD) (amounts in millions of euro) 2022 2021 2020 December, 31 December, 31 December,31 Abs. Value % Abs. Value % Abs. Value % (importi in milioni di euro) * Projects and initiativesDIRECT ECONOMIC VALUE GENERATED 1,478.3 100 1,341.0 100.0 1,261.50 100 DIRECT ECONOMIC VALUE DISTRIBUTED 1,341.4 90.7 1,220.2 91.0 1,142.40 90.6 Suppliers 564.6 38.2 499.0 37.2 440.5 34.8 Employees 719.0 48.6 674.0 50.3 637.8 50.6 Lenders 26.7 1.8 12.5 0.9 16 1.3 State 28.7 1.9 34.3 2.6 47.8 3.8 ** 2.5 0.2 0.5 0.0 0.3 0.1 Community DIRECT ECONOMIC VALUE RETAINED 136.9 9.3 120.8 9.0 119.1 9.4 (*) Value of production plus financial income. (**) Includes charitable donations and sponsorships with social impact. 56 Engineering © Engineering © 57
 2022 | ESG Report Page 56 Page 58