
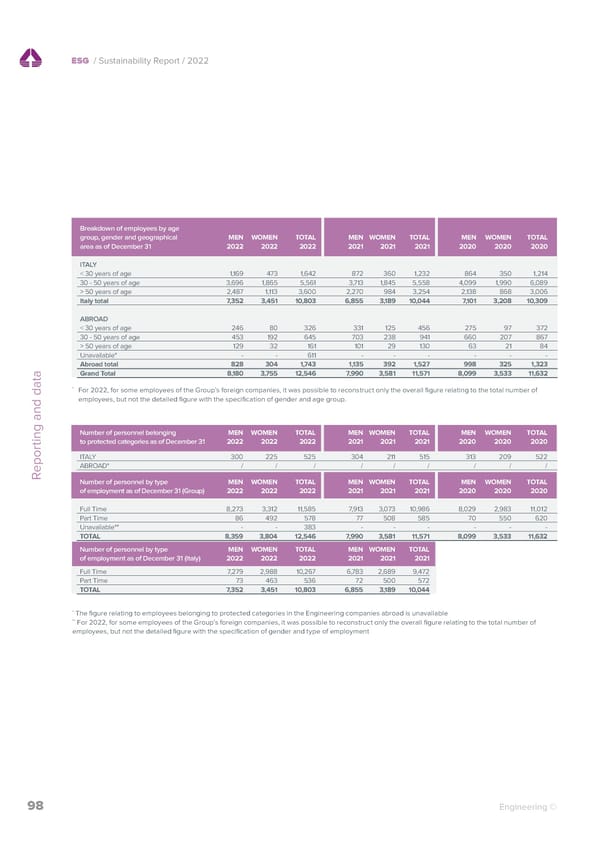
ESG / Sustainability Report / 2022 ESG / Sustainability Report / 2022 Breakdown of employees by age Breakdown of members of the Board of Directors MEN WOMEN TOTAL MEN WOMEN TOTAL MEN WOMEN TOTAL group, gender and geographical MEN WOMEN TOTAL MEN WOMEN TOTAL MEN WOMEN TOTAL by age group and gender as of December 31 * 2022 2022 2022 2021 2021 2021 2020 2020 2020 area as of December 31 2022 2022 2022 2021 2021 2021 2020 2020 2020 ITALY Number ITALY < 30 years of age 0 0 0 0 0 0 0 0 0 < 30 years of age 1,169 473 1,642 872 360 1,232 864 350 1,214 30 - 50 years of age 12 1 13 7 0 7 7 7 14 30 - 50 years of age 3,696 1,865 5,561 3,713 1,845 5,558 4,099 1,990 6,089 > 50 years of age 33 5 38 58 10 68 45 0 45 > 50 years of age 2,487 1,113 3,600 2,270 984 3,254 2,138 868 3,006 Italy total 45 6 51 65 10 75 52 7 59 Italy total 7,352 3,451 10,803 6,855 3,189 10,044 7,101 3,208 10,309 ITALY Rate ABROAD < 30 years of age 0% 0% 0% 0% 0% 0% 0% 0% 0% < 30 years of age 246 80 326 331 125 456 275 97 372 30 - 50 years of age 24% 2% 25% 9% 0% 9% 12% 12% 24% 30 - 50 years of age 453 192 645 703 238 941 660 207 867 > 50 years of age 65% 10% 75% 77% 13% 91% 76% 0% 76% * Per il 2022 per alcuni dipendenti delle società estere del Gruppo è stato possibile ricostruire solo il dato complessivo relativo al numero totale di dipendenti, Italy total 88% 12% 100% 87% 13% 100% 88% 12% 100% > 50 years of age 129 32 161 101 29 130 63 21 84 ma non il dato di dettaglio con la specifica del genere e della fascia di età di appartenenza. Unavailable* - - 611 - - - - - - ABROAD Number Abroad total 828 304 1,743 1,135 392 1,527 998 325 1,323 Grand Total 8,180 3,755 12,546 7,990 3,581 11,571 8,099 3,533 11,632 < 30 years of age 0 0 0 0 0 0 0 0 0 Reporting and data 30 - 50 years of age 20 1 21 19 8 27 12 1 13 * > 50 years of age 29 1 38 32 6 38 26 5 31 For 2022, for some employees of the Group’s foreign companies, it was possible to reconstruct only the overall figure relating to the total number of employees, but not the detailed figure with the specification of gender and age group. Abroad total 49 2 51 51 14 65 38 6 44 GROUP TOTAL 97 8 105 116 24 140 90 13 103 ABROAD Rate Number of personnel belonging MEN WOMEN TOTAL MEN WOMEN TOTAL MEN WOMEN TOTAL < 30 years of age 0% 0% 0% 0% 0% 0% 0% 0% 0% to protected categories as of December 31 2022 2022 2022 2021 2021 2021 2020 2020 2020 30 - 50 years of age 39% 2% 41% 29% 12% 42% 27% 2% 30% > 50 years of age 57% 2% 59% 49% 9% 58% 59% 11% 70% ITALY 300 225 525 304 211 515 313 209 522 Abroad total 96% 4% 100% 78% 22% 100% 86% 14% 100% ABROAD* / / / / / / / / / GROUP TOTAL 92% 8% 100% 83% 17% 100% 87% 13% 100% * Reporting and data Number of personnel by type MEN WOMEN TOTAL MEN WOMEN TOTAL MEN WOMEN TOTAL With reference to the Italian scope, the actual total of women is 2 and men is 37. For the companies Abroad, it was not possible to reconstruct the figure with this of employment as of December 31 (Group) 2022 2022 2022 2021 2021 2021 2020 2020 2020 degree of detail, but only with reference to the breakdown of members of the Board of Directors, with an indication of gender and age group, of the Group’s foreign companies. For the analysis set forth in the table, the members of the Board of Directors were counted on the basis of their membership in the various Boards of Full Time 8,273 3,312 11,585 7,913 3,073 10,986 8,029 2,983 11,012 Directors. The data relating to the breakdown of the Board of Directors for the Italian scope refer to the following companies: Engineering Ingegneria Informatica Part Time 86 492 578 77 508 585 70 550 620 S.p.A.; Engineering D.HUB S.p.A.; Cybertech Srl; Municipia S.p.A.; Engineering Sardegna Srl; Livebox Srl; Nexen S.p.A.; Webresults Srl; Digitelematica Srl; FDL Servizi Unavailable** - - 383 - - - - - - Srl; C.Consulting S.p.A.; Plusure S.p.A.; Atlantic Tecnologies S.p.A. TOTAL 8,359 3,804 12,546 7,990 3,581 11,571 8,099 3,533 11,632 Number of personnel by type MEN WOMEN TOTAL MEN WOMEN TOTAL Number of Group employees of employment as of December 31 (Italy) 2022 2022 2022 2021 2021 2021 by professional classification and gender Full Time 7,279 2,988 10,267 6,783 2,689 9,472 as of December 31, 2022 MEN WOMEN TOTAL MEN WOMEN TOTAL Part Time 73 463 536 72 500 572 Italy 2022 2022 2022 2021 2021 2021 TOTAL 7,352 3,451 10,803 6,855 3,189 10,044 Executives 352 72 424 314 66 380 Middle managers 1,652 560 2,212 1,562 508 2,070 * White-collar employees 5,342 2,819 8,161 4,973 2,615 7,588 The figure relating to employees belonging to protected categories in the Engineering companies abroad is unavailable ** Blue-collar employees 6 0 6 6 0 6 For 2022, for some employees of the Group’s foreign companies, it was possible to reconstruct only the overall figure relating to the total number of employees, but not the detailed figure with the specification of gender and type of employment TOTAL 7,352 3,451 10,803 6,855 3,189 10,044 Number of Group employees by professional classification and gender as of December 31, 2022 MEN WOMEN TOTAL MEN WOMEN TOTAL MEN WOMEN TOTAL Group 2022 2022 2022 2021 2021 2021 2020 2020 2020 Executives 371 74 445 325 69 394 330 62 392 Middle managers 1,748 588 2,336 1,588 520 2,108 1,542 492 2,034 White-collar employees 6,055 3,093 9,148 6,071 2,992 9,063 6,227 2,979 9,206 Blue-collar employees 6 0 6 6 0 6 0 0 0 Unavailable* - - 611 - - - - - - TOTAL 8,180 3,755 12,546 7,990 3,581 11,571 8,099 3,533 11,632 * For 2022, for some employees of the Group’s foreign companies, it was possible to reconstruct only the overall figure relating to the total number of employees, but not the detailed figure with the specification of gender and professional classification 98 Engineering © Engineering © 99
 2022 | ESG Report Page 97 Page 99