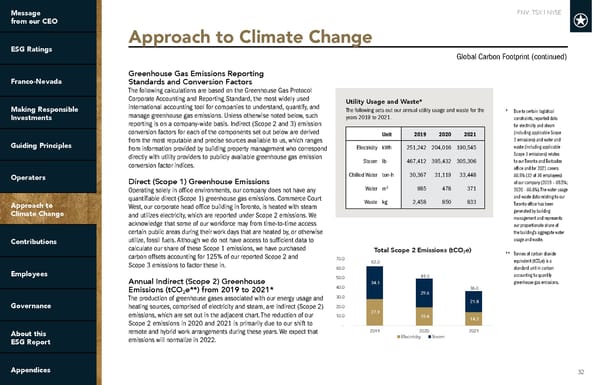
FNV: TSX | NYSE 32 27.9 19.4 14.2 34.1 29.6 21.8 62.0 49.0 36.0 - 10.0 20.0 30.0 40.0 50.0 60.0 70.0 2019 2020 2021 Electricity Steam Greenhouse Gas Emissions Reporting Standards and Conversion Factors The following calculations are based on the Greenhouse Gas Protocol Corporate Accounting and Reporting Standard, the most widely used international accounting tool for companies to understand, quantify, and manage greenhouse gas emissions. Unless otherwise noted below, such reporting is on a company-wide basis. Indirect (Scope 2 and 3) emission conversion factors for each of the components set out below are derived from the most reputable and precise sources available to us, which ranges from information provided by building property management who correspond directly with utility providers to publicly available greenhouse gas emission conversion factor indices. Direct (Scope 1) Greenhouse Emissions Operating solely in office environments, our company does not have any quantifiable direct (Scope 1) greenhouse gas emissions. Commerce Court West, our corporate head office building in Toronto, is heated with steam and utilizes electricity, which are reported under Scope 2 emissions. We acknowledge that some of our workforce may from time-to-time access certain public areas during their work days that are heated by, or otherwise utilize, fossil fuels. Although we do not have access to sufficient data to calculate our share of these Scope 1 emissions, we have purchased carbon offsets accounting for 125% of our reported Scope 2 and Scope 3 emissions to factor these in. Annual Indirect (Scope 2) Greenhouse Emissions (tCO 2 e**) from 2019 to 2021* The production of greenhouse gases associated with our energy usage and heating sources, comprised of electricity and steam, are indirect (Scope 2) emissions, which are set out in the adjacent chart. The reduction of our Scope 2 emissions in 2020 and 2021 is primarily due to our shift to remote and hybrid work arrangements during these years. We expect that emissions will normalize in 2022. * Due to certain logistical constraints, reported data for electricity and steam (including applicable Scope 2 emissions) and water and waste (including applicable Scope 3 emissions) relates to our Toronto and Barbados office and for 2021 covers 88.9% (32 of 36 employees) of our company (2019 – 89.5%; 2020 - 88.6%). The water usage and waste data relating to our Toronto office has been generated by building management and represents our proportionate share of the building’s aggregate water usage and waste. ** Tonnes of carbon dioxide equivalent (tCO 2 e) is a standard unit in carbon accounting to quantify greenhouse gas emissions. Approach to Climate Change Utility Usage and Waste* The following sets out our annual utility usage and waste for the years 2019 to 2021. Unit 2019 2020 2021 Electricity kWh 251,242 204,016 190,545 Steam lb 467,412 395,432 305,306 Chilled Water ton-h 30,367 31,119 33,448 Water m 3 985 478 371 Waste kg 2,458 850 833 Global Carbon Footprint (continued) Total Scope 2 Emissions (tCO 2 e)
 2022 ESG Report | Franco-Nevada Page 31 Page 33