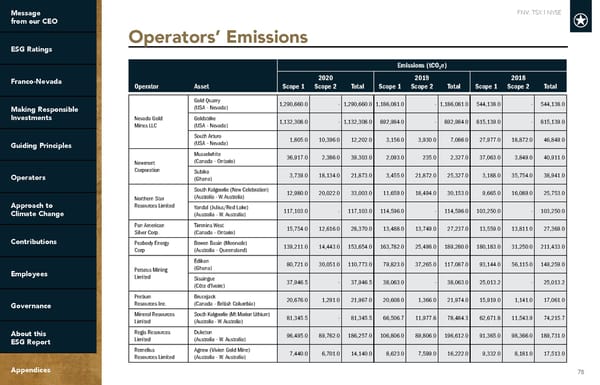
FNV: TSX | NYSE 78 Operators’ Emissions Emissions (tCO 2 e) 2020 2019 2018 Operator Asset Scope 1 Scope 2 Total Scope 1 Scope 2 Total Scope 1 Scope 2 Total Nevada Gold Mines LLC Gold Quarry (USA - Nevada) 1,290,660.0 - 1,290,660.0 1,186,081.0 - 1,186,081.0 544,138.0 - 544,138.0 Goldstrike (USA - Nevada) 1,132,308.0 - 1,132,308.0 892,984.0 - 892,984.0 815,139.0 - 815,139.0 South Arturo (USA - Nevada) 1,805.0 10,396.0 12,202.0 3,156.0 3,930.0 7,086.0 27,977.0 18,872.0 46,849.0 Newmont Corporation Musselwhite (Canada - Ontario) 36,917.0 2,386.0 39,303.0 2,093.0 235.0 2,327.0 37,063.0 3,849.0 40,911.0 Subika (Ghana) 3,739.0 18,134.0 21,873.0 3,455.0 21,872.0 25,327.0 3,188.0 35,754.0 38,941.0 Northern Star Resources Limited South Kalgoorlie (New Celebration) (Australia - W. Australia) 12,980.0 20,022.0 33,003.0 11,659.0 18,494.0 30,153.0 9,665.0 16,089.0 25,753.0 Yandal (Julius/Red Lake) (Australia - W. Australia) 117,103.0 - 117,103.0 114,596.0 - 114,596.0 103,250.0 - 103,250.0 Pan American Silver Corp. Timmins West (Canada - Ontario) 15,754.0 12,616.0 28,370.0 13,488.0 13,749.0 27,237.0 13,559.0 13,811.0 27,369.0 Peabody Energy Corp Bowen Basin (Moorvale) (Australia - Queensland) 139,211.0 14,443.0 153,654.0 163,782.0 25,498.0 189,280.0 180,183.0 31,250.0 211,433.0 Perseus Mining Limited Edikan (Ghana) 80,721.0 30,051.0 110,773.0 79,823.0 37,265.0 117,087.0 93,144.0 56,115.0 149,259.0 Sissingue (Côte d’Ivoire) 37,946.5 - 37,946.5 38,063.0 - 38,063.0 25,013.2 - 25,013.2 Pretium Resources Inc. Brucejack (Canada - British Columbia) 20,676.0 1,291.0 21,967.0 20,608.0 1,366.0 21,974.0 15,919.0 1,141.0 17,061.0 Mineral Resources Limited South Kalgoorlie (Mt Marion Lithium) (Australia - W. Australia) 81,345.5 - 81,345.5 66,506.7 11,977.6 78,484.3 62,671.8 11,543.9 74,215.7 Regis Resources Limited Duketon (Australia - W. Australia) 96,495.0 89,762.0 186,257.0 106,806.0 89,806.0 196,612.0 91,365.0 98,366.0 189,731.0 Remelius Resources Limited Agnew (Vivien Gold Mine) (Australia - W. Australia) 7,440.0 6,701.0 14,140.0 8,623.0 7,599.0 16,222.0 9,332.0 8,181.0 17,513.0
 2022 ESG Report | Franco-Nevada Page 77 Page 79