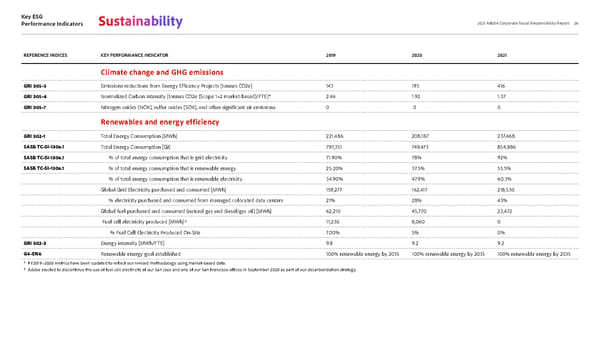
Key ESG Performance Indicators 26 2021 Adobe Corporate Social Responsibility Report Sustainability REFERENCE INDICES KEY PERFORMANCE INDICATOR 2019 2020 2021 Climate change and GHG emissions GRI 305-5 Emissions reductions from Energy Efficency Projects [tonnes CO2e] 143 195 416 GRI 305-4 Normalized Carbon Intensity [tonnes CO2e (Scope 1+2 market-based)/FTE]* 2.46 1.92 1.37 GRI 305-7 Nitrogen oxides (NOX), sulfur oxides (SOX), and other significant air emissions 0 0 0 Renewables and energy efficiency GRI 302-1 Total Energy Consumption [MWh] 221,486 208,187 2 37,4 68 SASB TC-SI-130a.1 Total Energy Consumption [GJ] 797, 351 749,473 854,886 SASB TC-SI-130a.1 % of total energy consumption that is grid electricity 71.90% 78% 92% SASB TC-SI-130a.1 % of total energy consumption that is renewable energy 25.20% 37. 5% 55.5% % of total energy consumption that is renewable electricity 34.90% 47.9% 60.3% Global Grid Electricity purchased and consumed [MWh] 159, 27 7 162,417 218,530 % electricity purchased and consumed from managed colocated data centers 21% 28% 43% Global fuel purchased and consumed (natural gas and diesel/gas oil) [MWh} 62,210 45,770 23,472 Fuel cell electricity produced [MWh] † 11,230 8,060 0 % Fuel Cell Electricity Produced On-Site 7.0 0% 5% 0% GRI 302-3 Energy intensity [MWh/FTE] 9.8 9. 2 9. 2 G4-EN6 Renewable energy goal established 100% renewable energy by 2035 100% renewable energy by 2035 100% renewable energy by 2035 * FY2019–2020 metrics have been updated to reflect our revised methodology using market-based data. † Adobe elected to discontinue the use of fuel cell electricity at our San Jose and one of our San Francisco offices in September 2020 as part of our decarbonization strategy.
 Adobe Sustainability Social Report Page 25 Page 27