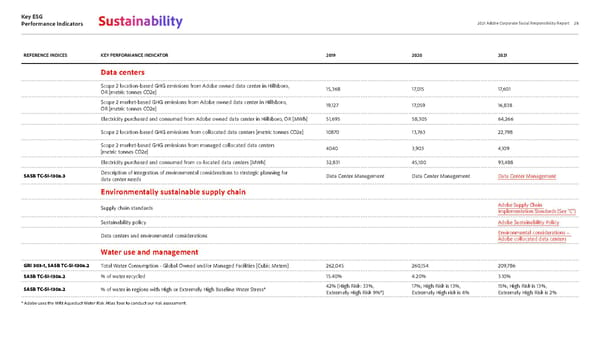
Key ESG Performance Indicators 28 2021 Adobe Corporate Social Responsibility Report Sustainability REFERENCE INDICES KEY PERFORMANCE INDICATOR 2019 2020 2021 Data centers Scope 2 location-based GHG emissions from Adobe owned data center in Hillsboro, OR [metric tonnes CO2e] 15,368 17,015 17, 601 Scope 2 market-based GHG emissions from Adobe owned data center in Hillsboro, OR [metric tonnes CO2e] 19,127 17,059 16,838 Electricity purchased and consumed from Adobe owned data center in Hillsboro, OR [MWh] 51,695 58,305 64,266 Scope 2 location-based GHG emissions from collocated data centers [metric tonnes CO2e] 10870 13,763 22,798 Scope 2 market-based GHG emissions from managed collocated data centers [metric tonnes CO2e] 4040 3,903 4,109 Electricity purchased and consumed from co-located data centers [MWh] 32,831 45,100 93,488 SASB TC-SI-130a.3 Description of integration of environmental considerations to strategic planning for data center needs Data Center Management Data Center Management Data Center Management Environmentally sustainable supply chain Supply chain standards Adobe Supply Chain Implementation Standards (See "C") Sustainability policy Adobe Sustainability Policy Data centers and environmental considerations Environmental considerations – Adobe collocated data centers Water use and management GRI 303-1, SASB TC-SI-130a.2 Total Water Consumption - Global Owned and/or Managed Facilities [Cubic Meters] 262,045 260,154 209,786 SASB TC-SI-130a.2 % of water recycled 15.40% 4.20% 3.10% SASB TC-SI-130a.2 % of water in regions with High or Extremely High Baseline Water Stress* 42% (High Risk: 33%, Extremely High Risk 9%*) 17%; High Risk is 13%, Extremely High risk is 4% 15%; High Risk is 13%, Extremely High Risk is 2% * Adobe uses the WRI Aqueduct Water Risk Atlas Tool to conduct our risk assessment.
 Adobe Sustainability Social Report Page 27 Page 29