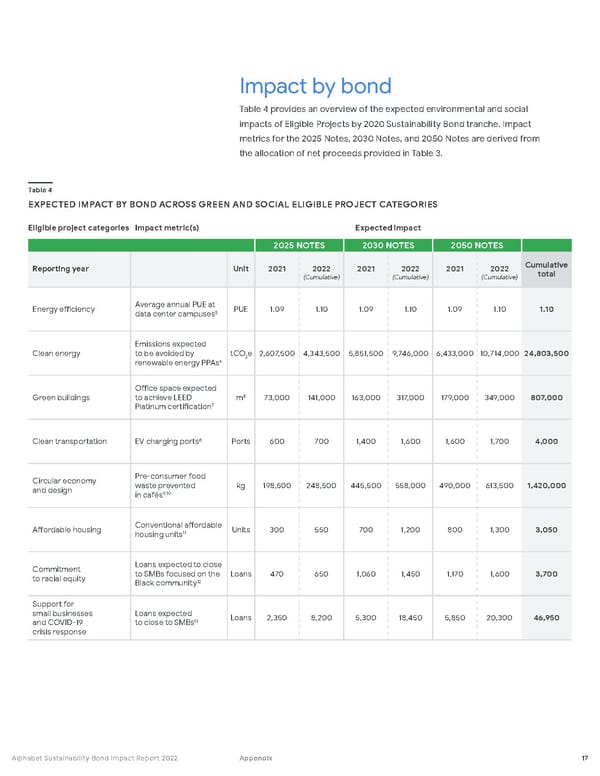
Impact by bond Table 4 provides an overview of the expected environmental and social impacts of Eligible Projects by 2020 Sustainability Bond tranche. Impact metrics for the 2025 Notes, 2030 Notes, and 2050 Notes are derived from the allocation of net proceeds provided in Table 3. Eligible project categories Impact metric(s) Expected impact 2025 NOTES 2030 NOTES 2050 NOTES Reporting year Unit 2021 2022 (Cumulative) 2021 2022 (Cumulative) 2021 2022 (Cumulative) Cumulative total Energy efficiency Average annual PUE at data center campuses 5 PUE 1.09 1.10 1.09 1.10 1.09 1.10 1.10 Clean energy Emissions expected to be avoided by renewable energy PPAs 6 tCO 2 e 2,607,500 4,343,500 5,851,500 9,746,000 6,433,000 10,714,000 24,803,500 Green buildings Office space expected to achieve LEED Platinum certification 7 m² 73,000 141,000 163,000 317,000 179,000 349,000 807,000 Clean transportation EV charging ports 8 Ports 600 700 1,400 1,600 1,600 1,700 4,000 Circular economy and design Pre-consumer food waste prevented in cafés 9 , 10 kg 198,500 248,500 445,500 558,000 490,000 613,500 1,420,000 Affordable housing Conventional affordable housing units 11 Units 300 550 700 1,200 800 1,300 3,050 Commitment to racial equity Loans expected to close to SMBs focused on the Black community 12 Loans 470 650 1,060 1,450 1,170 1,600 3,700 Support for small businesses and COVI D -19 crisis response Loans expected to close to SMBs 13 Loans 2,350 8,200 5,300 18,450 5,850 20,300 46,950 Table 4 EXPECTED IMPACT BY BOND ACROSS GREEN AND SOCIAL ELIGIBLE PROJECT CATEGORIES 17 Alphabet Sustainability Bond Impact Report 2022 Appendix
 Alphabet ESG Report Page 17 Page 19