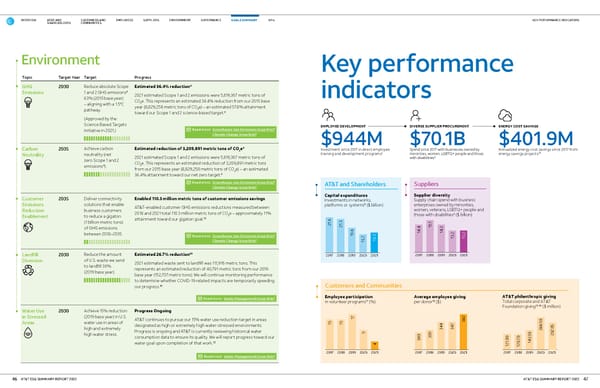
Environment Topic Target Year Target Progress GHG Emissions 2030 Reduce absolute Scope 1 and 2 GHG emissions 4 63% (2015 base year) – aligning with a 1.5°C pathway. (Approved by the Science Based Targets initiative in 2021.) Estimated 36.4% reduction 4 2021 estimated Scope 1 and 2 emissions were 5,619,367 metric tons of CO 2 e. This represents an estimated 36.4% reduction from our 2015 base year (8,829,258 metric tons of CO 2 e) – an estimated 57.8% attainment toward our Scope 1 and 2 science-based target. 4 Read more: Greenhous e Gas Emissions Issue Brief Climate Change Issue Brief Carbon Neutrality 2035 Achieve carbon neutrality (net zero Scope 1 and 2 emissions 4 ). Estimated reduction of 3,209,891 metric tons of CO 2 e 4 2021 estimated Scope 1 and 2 emissions were 5,619,367 metric tons of CO 2 e. This represents an estimated reduction of 3,209,891 metric tons from our 2015 base year (8,829,258 metric tons of CO 2 e) – an estimated 36.4% attainment toward our net zero target. 4 Read more: Greenhous e Gas Emissions Issue Brief Climate Change Issue Brief Customer Emissions Reduction Enablement 2035 Deliver connectivity solutions that enable business customers to reduce a gigaton (1 billion metric tons) of GHG emissions between 2018–2035. Enabled 110.3 million metric tons of customer emissions savings AT&T-enabled customer GHG emissions reductions measured between 2018 and 2021 total 110.3 million metric tons of CO 2 e – approximately 11% attainment toward our gigaton goal. 22 Read more: Greenhous e Gas Emissions Issue Brief Climate Change Issue Brief Landfill Diversion 2030 Reduce the amount of U.S. waste we send to landfill 30% (2019 base year). Estimated 26.7% reduction 30 2021 estimated waste sent to landfill was 111,916 metric tons. This represents an estimated reduction of 40,791 metric tons from our 2019 base year (152,707 metric tons). We will continue monitoring performance to determine whether COVID-19 related impacts are temporarily speeding our progress. 30 Read more: Waste Management Issue Brief Water Use in Stressed Areas 2030 Achieve 15% reduction (2019 base year) in U.S. water use in areas of high and extremely high water stress. Progress Ongoing AT&T continues to pursue our 15% water use reduction target in areas designated as high or extremely high water-stressed environments. Progress is ongoing and AT&T is currently reviewing historical water consumption data to ensure its quality. We will report progress toward our water goal upon completion of that work. 32 Read more: Water Management Issue Brief OVERVIEW AT&T AND SHAREHOLDERS CUSTOMERS AND COMMUNITIES EMPLOYEES SUPPLIERS ENVIRONMENT GOVERNANCE GOALS SUMMARY KEY PERFORMANCE INDICATORS Customers and Communities 2017 2017 2017 2018 2018 2018 2019 2019 2019 2020 2020 2020 2021 2021 2021 15 300 121.0 0 15 309 120.7 0 17 344 143.9 0 9 347 288.5 0 4 382 AT&T philanthropic giving Total corporate and AT& T Foundation giving 1 5 , 34 ($ million) Employee participation in volunteer programs 17 (%) Average employee giving per donor 33 ($) Key performance indicators EMPLOYEE DEVELOPMENT $944M Investment since 2017 in direct employee training and development programs 2 DIVERSE SUPPLIER PROCUREMENT $70.1B Spend since 2017 with businesses owned by minorities, women, LGBTQ+ people and those with disabilities 3 ENERGY COST SAVINGS $401.9M Annualized energy cost savings since 2017 from energy savings projects 23 Capital expenditures Investments in networks, platforms or systems 9 ($ billion) AT&T and Shareholders 2017 2018 2019 2020 2021 21.6 21.3 19.6 15.7 16.5 Suppliers 2017 2018 2019 2020 2021 14.4 15 .1 14.2 13.2 13.2 Supplier diversity Supply chain spend with business enterprises owned by minorities, women, veterans, LGBTQ+ people and those with disabilities 3 ($ billion) KPI s AT&T ESG SUMMARY REPORT 2022 AT&T ESG SUMMARY REPORT 2022 46 47 202.05
 AT&T ESG Summary Page 24 Page 26