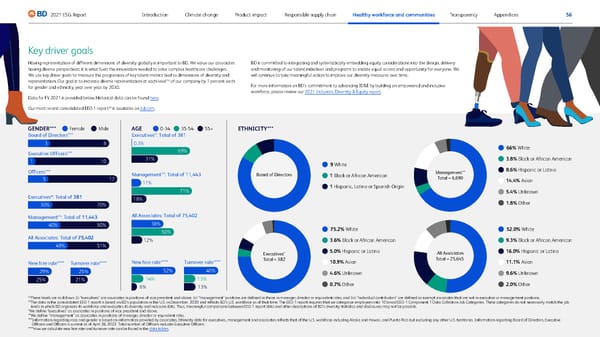
56 2021 ESG Report Appendices Transparency Responsible supply chain Product impact Climate change Introduction Healthy workforce and communities Key driver goals Having representation of different dimensions of diversity globally is important to BD. We value our associates having diverse perspectives; it is what fuels the innovation needed to solve complex healthcare challenges. We use key driver goals to measure the progression of key talent metrics tied to dimensions of diversity and representation. Our goal is to increase diverse representation at each level 14 of our company by 1 percent each for gender and ethnicity, year over year, by 2030. Data for FY 2021 is provided below. Historical data can be found here . Our most recent consolidated EEO-1 report 15 is available on bd.com . BD is committed to integrating and systematically embedding equity considerations into the design, delivery and monitoring of our talent initiatives and programs to enable equal access and opportunity for everyone. We will continue to take meaningful action to improve our diversity measures over time. For more information on BD’s commitment to advancing ID&E by building an empowered and inclusive workforce, please review our 2021 Inclusion, Diversity & Equity report . ETHNICITY*** GENDER*** Female Male AGE 0-34 35-54 55+ 9 White 1 Hispanic, Latino or Spanish Origin 1 Black or African American Board of Directors 75.2% White 10.9% Asian 5.0% Hispanic or Latino 4.6% Unknown 3.6% Black or African American 0.7% Other Executives* Total – 382 66% White 14.4% Asian 8.6% Hispanic or Latino 5.4% Unknown 3.8% Black or African American 1.8% Other Management** Total – 6,690 52.0% White 11.1% Asian 16.0% Hispanic or Latino 9.6% Unknown 9.3% Black or African American 2.0% Other All Associates Total – 25,645 New hi re rate****Turnover rate**** Executive Officers*** Board of Directors*** Officers*** A ll Associates: Total of 75,402 M anagement**: Total of 11,443 E xecutives * : Total of 381 3 8 1 10 5 17 30% 70% 40% 29% 25% 25% 21% 60% 49% 51% Executives*: Total of 381 0.3% 11% 12% 14% 6% 13% 13% New hire rate****Turnover rate**** Management**: Total of 11,443 All Associates: Total of 75,402 69% 31% 71% 18% 38% 50% 52% 40% 14 These levels are as follows: (i) “executives” are associates in positions of vice president and above; (ii) “management” positions are defined as those in manager, director or equivalent roles; and (iii) “individual contributors” are defined as exempt associates that are not in executive or management positions. 15 The data in the consolidated EEO-1 report is based on BD’s population in the U.S. in December 2020 and reflects BD’s U.S. workforce as of that time. The EEO-1 report requires that we categorize employees into 10 broad EEO-1 Component 1 Data Collection Job Categories. These categories do not necessarily match the job levels in which BD organizes its workforce and evaluates its diversity and inclusion data. Thus, meaningful comparisons between EEO-1 report data and other descriptions of BD’s diversity statistics and disclosures may not be possible. *We define “executives” as associates in positions of vice president and above. **We define “management” as associates in positions of manager, director or equivalent roles. *** Inf ormation regarding race and gender is based on information provided by associates. Ethnicity data for executives, management and associates reflects that of the U.S. workforce including Alaska and Hawaii, and Puerto Rico but excluding any other U.S. territories. Information regarding Board of Directors, Executive Officers and Officers is current as of April 26, 2022. Total number of Officers includes Executive Officers. ****How we calculate new hire rate and turnover rate can be found in the data tables .
 BD ESG Report Page 55 Page 57