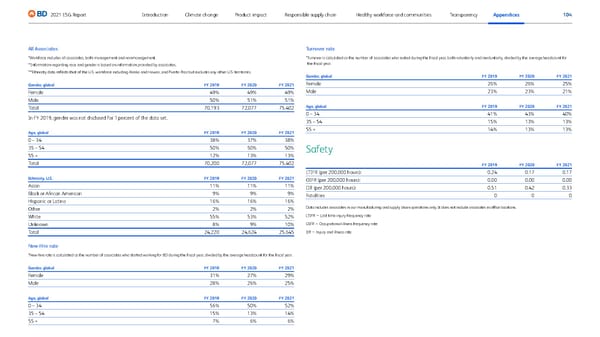
104 2021 ESG Report Transparency Appendices Responsible supply chain Product impact Climate change Introduction Healthy workforce and communities All Associates *Workforce includes all associates, both management and nonmanagement. **Information regarding race and gender is based on information provided by associates. ***Ethnicity data reflects that of the U.S. workforce including Alaska and Hawaii, and Puerto Rico but excludes any other U.S. territories. Gender, global FY 2019 FY 2020 FY 2021 Female 49% 49% 49% Male 50% 51% 51% Total 70,193 72,077 75,402 In FY 2019, gender was not disclosed for 1 percent of the data set. Age, global FY 2019 FY 2020 FY 2021 0 – 34 38% 37% 38% 35 – 54 50% 50% 50% 55 + 12% 13% 13% Total 70,200 72,077 75,402 Ethnicity, U.S. FY 2019 FY 2020 FY 2021 Asian 11% 11% 11% Black or African American 9% 9% 9% Hispanic or Latino 16% 16% 16% Other 2% 2% 2% White 55% 53% 52% Unknown 8% 9% 10% Total 24,220 24,624 25,645 New-Hire rate *New-hire rate is calculated as the number of associates who started working for BD during the fiscal year, divided by the average headcount for the fiscal year. Gender, global FY 2019 FY 2020 FY 2021 Female 31% 27% 29% Male 28% 26% 25% Age, global FY 2019 FY 2020 FY 2021 0 – 34 56% 50% 52% 35 – 54 15% 13% 14% 55 + 7% 6% 6% Turnover rate * T urnover is calculated as the number of associates who exited during the fiscal year, both voluntarily and involuntarily, divided by the average headcount for the fiscal year. Gender, global FY 2019 FY 2020 FY 2021 Female 26% 26% 25% Male 23% 23% 21% Age, global FY 2019 FY 2020 FY 2021 0 – 34 41% 43% 40% 35 – 54 15% 13% 13% 55 + 14% 13% 13% Safety FY 2019 FY 2020 FY 2021 LTIFR (per 200,000 hours): 0.24 0.17 0.17 OIFR (per 200,000 hours): 0.00 0.00 0.00 IIR (per 200,000 hours): 0.51 0.42 0.33 Fatalities 0 0 0 Data includes associates in our manufacturing and supply chain operations only. It does not include associates in office locations. LTIFR – Lost time injury frequency rate OIFR – Occupational illness frequency rate IIR – Injury and illness rate
 BD ESG Report Page 103 Page 105