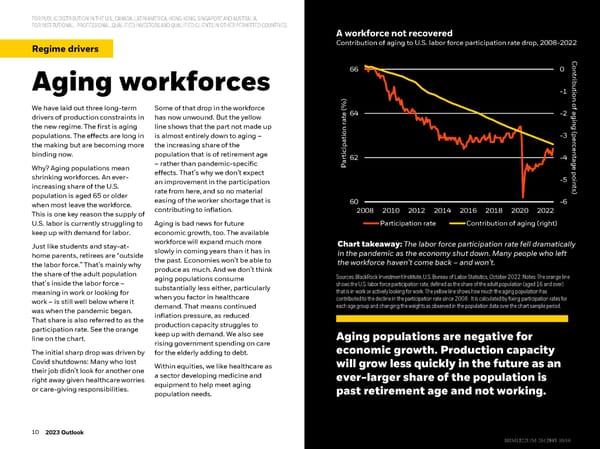
FOR PUBLIC DISTRIBUTION IN THE U.S., CANADA, LATIN AMERICA, HONGKONG, SINGAPORE AND AUSTRALIA. FOR INSTITUTIONAL, PROFESSIONAL, QUALIFIED INVESTORS AND QUALIFIED CLIENTS IN OTHER PERMITTED COUNTRIES. A workforce not recovered Regime drivers Contribution of aging to U.S. labor force participation rate drop, 2008-2022 A workforce not recovered Aging populations are negative for economic growth. Production ontriC 66 0 capacity will grow less quickly in the future as populations age and Aging workforces younger generations fail to replace them. -1 buti on We have laid out three long-term Some of that drop in the workforce (%) of drivers of production constraints in has now unwound. But the yellow 64 -2 agi the new regime. The first is aging line shows that the part not made up ate r g n populations. The effects are long in is almost entirely down to aging – on -3 (per the making but are becoming more the increasing share of the cipati centage binding now. population that is of retirement age arti62 -4 Why? Aging populations mean –rather than pandemic-specific P shrinking workforces. An ever- effects. That’s why we don’t expect poi increasing share of the U.S. an improvement in the participation -5 tsn population is aged 65 or older rate from here, and so no material ) when most leave the workforce. easing of the worker shortage that is 60 -6 This is one key reason the supply of contributing to inflation. 2008 2010 2012 2014 2016 2018 2020 2022 U.S. labor is currently struggling to Aging is bad news for future Participation rate Contribution of aging (right) keep up with demand for labor. economic growth, too. The available Just like students and stay-at- workforce will expand much more Chart takeaway: The labor force participation rate fell dramatically slowly in coming years than it has in in the pandemic as the economy shut down. Many people who left home parents, retirees are “outside the past. Economies won’t be able to the workforce haven’t come back –and won’t. the labor force.” That’s mainly why the share of the adult population produce as much. And we don’t think aging populations consume Sources: BlackRock Investment Institute, U.S. Bureau of LaborStatistics, October 2022. Notes: The orange line that’s inside the labor force – substantially less either, particularly shows the U.S. laborforce participation rate, defined as the share of the adult population (aged 16 and over) meaning in work or looking for when you factor in healthcare that is in work or actively looking for work. The yellow line shows how much the aging population has work –is still well below where it contributed to the decline in the participation rate since 2008. It is calculated by fixing participation rates for was when the pandemic began. demand. That means continued each age group and changing the weights as observed in the population data over the chart sample period. That share is also referred to as the inflation pressure, as reduced participation rate. See the orange production capacity struggles to line on the chart. keep up with demand. We also see Aging populations are negative for rising government spending on care economic growth. Production capacity The initial sharp drop was driven by for the elderly adding to debt. Covid shutdowns: Many who lost Within equities, we like healthcare as will grow less quickly in the future as an their job didn’t look for another one a sector developing medicine and ever-larger share of the population is right away given healthcare worries equipment to help meet aging or care-giving responsibilities. population needs. past retirement age and not working. 1010 10 2022 midyear outlook 2023 Outlook BBIIIIMM1122U/M1222U/M--26121472617935--1010/16/16
 BlackRock 2023 Global Outlook Page 9 Page 11