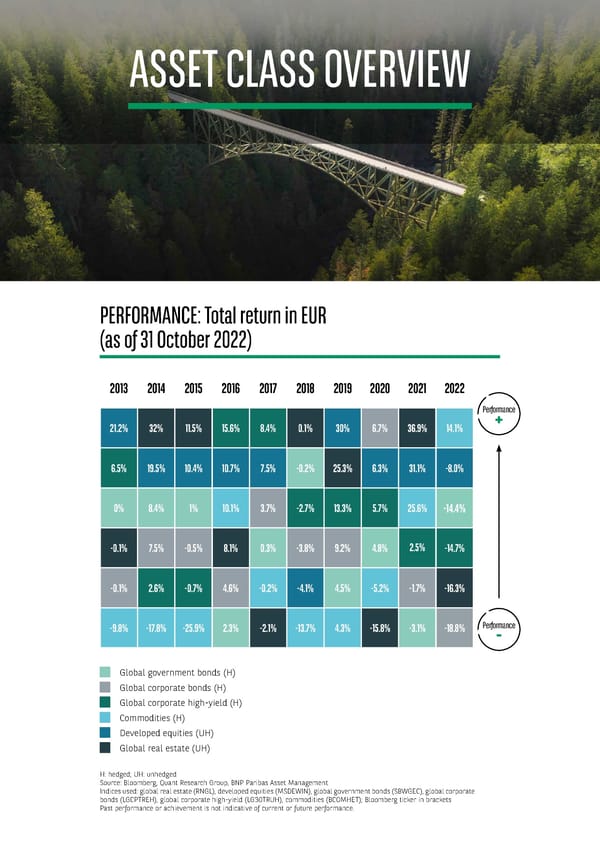
INVESTMENT OUTLOOK FOR 2023 - 31 - ASSET CLASS OVERVIEW PERFORMANCE: Total return in EUR (as of 31 October 2022) 2013 2014 2015 2016 2017 2018 2019 2020 2021 2022 Performance 21.2% 32% 11.5% 15.6% 8.4% 0.1% 30% 6.7% 36.9% 14.1% + 6.5% 19.5% 10.4% 10.7% 7.5% -0.2% 25.3% 6.3% 31.1% -8.0% 0% 8.4% 1% 10.1% 3.7% -2.7% 13.3% 5.7% 25.6% -14.4% -0.1% 7.5% -0.5% 8.1% 0.3% -3.8% 9.2% 4.8% 2.5% -14.7% -0.1% 2.6% -0.7% 4.6% -0.2% -4.1% 4.5% -5.2% -1.7% -16.3% -9.8% -17.8% -25.9% 2.3% -2.1% -13.7% 4.3% -15.8% -3.1% -18.8% Performance - Global government bonds (H) Global corporate bonds (H) Global corporate high-yield (H) Commodities (H) Developed equities (UH) Global real estate (UH) H: hedged; UH: unhedged Source: Bloomberg, Quant Research Group, BNP Paribas Asset Management Indices used: global real estate (RNGL), developed equities (MSDEWIN), global government bonds (SBWGEC), global corporate bonds (LGCPTREH), global corporate high-yield (LG30TRUH), commodities (BCOMHET); Bloomberg ticker in brackets Past performance or achievement is not indicative of current or future performance.
 BNP Paribas The Investment Outlook for 2023 Page 30 Page 32