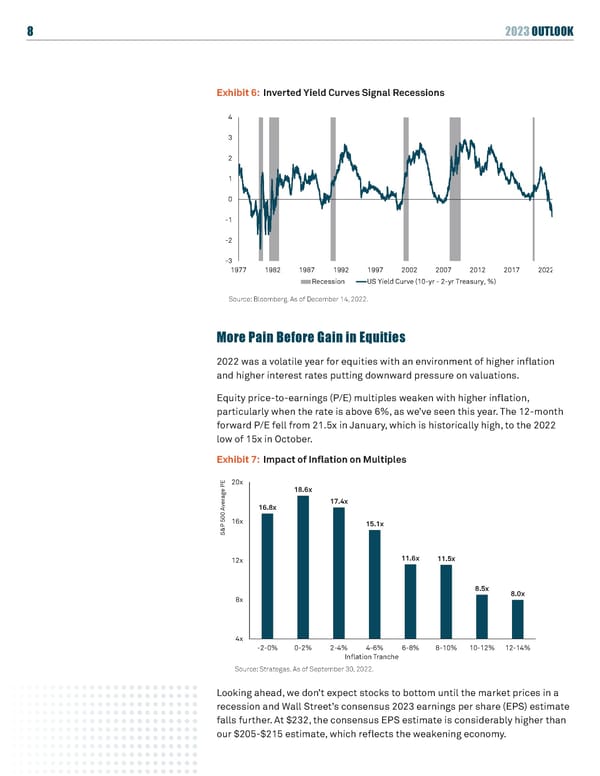
8 2023 OUTLOOK Exhibit 6: Inverted Yield Curve Typically Coincide with Recessions Exhibit 6: Inverted Yield Curves Signal Recessions 4 3 2 1 0 -1 -2 -3 1977 1982 1987 1992 1997 2002 2007 2012 2017 2022 Recession US Yield Curve (10-yr - 2-yr Treasury, Source: Bloomberg. As of December 14, 2022. 7 Source: Bloomberg. As of 12/14/22 More Pain Before Gain in Equities 2022 was a volatile year for equities with an environment of higher inflation and higher interest rates putting downward pressure on valuations. Equity price-to-earnings (P/E) multiples weaken with higher inflation, particularly when the rate is above 6%, as we’ve seen this year. The 12-month forward P/E fell from 21.5x in January, which is historically high, to the 2022 low of 15x in October. Exhibit 7: Impact of Inflation on Multiples Exhibit 7: Impact of Inflation on Multiples E 20x P 18.6x ge a r 17.4x e v 16.8x 500 A 16x 15.1x P & S 12x 11.6x 11.5x 8.5x 8.0x 8x 4x -2-0% 0-2% 2-4% 4-6% 6-8% 8-10% 10-12% 12-14% Inflation Tranche Source: Strategas. As of September 30, 2022. Looking ahead, we don’t expect stocks to bottom until the market prices in a 8 *Source: Strategas. Data as of Q3 2022 recession and Wall Street’s consensus 2023 earnings per share (EPS) estimate falls further. At $232, the consensus EPS estimate is considerably higher than our $205-$215 estimate, which reflects the weakening economy.
 BNY Mellon 2023 Outlook Page 7 Page 9