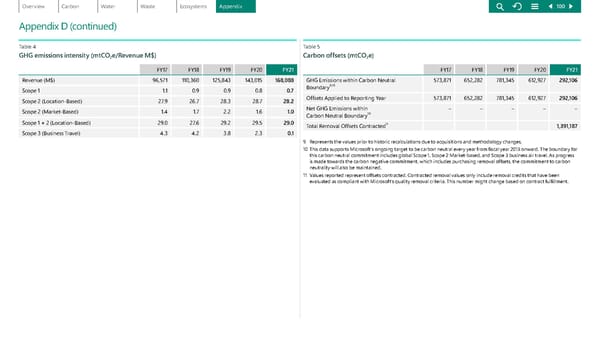
Appendix D (continued) Table 4 GHG emissions intensity (mtCO 2 e/Revenue M$) FY17 FY18 FY19 FY20 FY21 Revenue (M$) 96,571 110,360 125,843 143,015 168,088 Scope 1 1.1 0.9 0.9 0.8 0.7 Scope 2 (Location-Based) 27. 9 26.7 28.3 28.7 28.2 Scope 2 (Market-Based) 1.4 1.7 2.2 1.6 1.0 Scope 1 + 2 (Location-Based) 29.0 27. 6 29.2 29.5 29.0 Scope 3 (Business Travel) 4.3 4.2 3.8 2.3 0.1 Table 5 Carbon offsets ( mtCO 2 e) FY17 FY18 FY19 FY20 FY21 GHG Emissions within Carbon Neutral Bo undary 9,10 573,871 652,282 781,345 612,927 292,106 Offsets Applied to Reporting Year 573,871 652,282 781,345 612,927 292,106 Net GHG Emissions within Ca rbon Neutral Boundary 10 – – – – – Total Removal Offsets Contracted 11 1,391,187 9 Represents the values prior to historic recalculations due to acquisitions and methodology changes. 10 This data supports Microsoft's ongoing target to be carbon neutral every year from fiscal year 2013 onward. The boundary for th is carbon neutral commitment includes global Scope 1, Scope 2 Market-based, and Scope 3 business air travel. As progress is made towards the carbon negative commitment, which includes purchasing removal offsets, the commitment to carbon neutrality will also be maintained. 11 Values reported represent offsets contracted. Contracted removal values only include removal credits that have been ev aluated as compliant with Microsoft’s quality removal criteria. This number might change based on contract fulfillment. 100
 Environmental Sustainability Report | Microsoft Page 99 Page 101