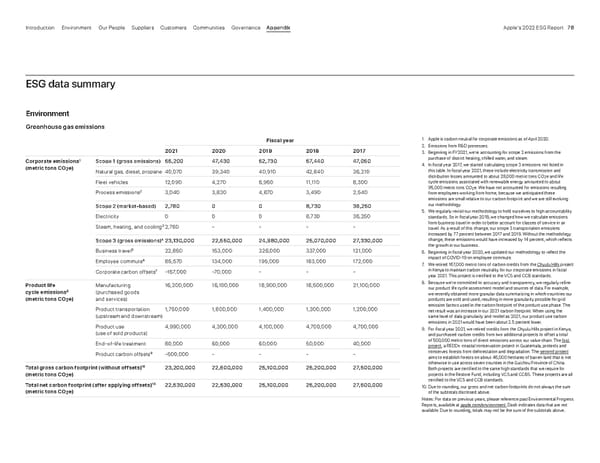
ESG data summary Fiscal year 2021 2020 2019 2018 2017 Corporate emissions 1 (metric tons CO 2 e) Scope 1 (gross emissions) 55,200 47,430 52,730 57,440 47,050 Natural gas, diesel, propane 40,070 39,340 40,910 42,840 36,210 Fleet vehicles 12,090 4,270 6,950 11,110 8,300 Process emissions 2 3,040 3,830 4,870 3,490 2,540 Scope 2 (market-based) 2,780 0 0 8,730 36,250 Electricity 0 0 0 8,730 36,250 Steam, heating, and cooling 3 2,780 - - - - Scope 3 (gross emissions) 4 23,130,000 22,550,000 24,980,000 25,070,000 27,330,000 Business travel 5 22,850 153,000 326,000 337,000 121,000 Employee commute 6 85,570 134,000 195,000 183,000 172,000 Corporate carbon offsets 7 -167,000 -70,000 - - - Product life cycle emissions 8 (metric tons CO 2 e) Manufacturing (purchased goods and services) 16,200,000 16,100,000 18,900,000 18,500,000 21,100,000 Product transportation (upstream and downstream) 1,750,000 1,800,000 1,400,000 1,300,000 1,200,000 Product use (use of sold products) 4,990,000 4,300,000 4,100,000 4,700,000 4,700,000 End-of-life treatment 80,000 60,000 60,000 50,000 40,000 Product carbon offsets 9 -500,000 - - - - Total gross carbon footprint (without offsets) 10 (metric tons CO 2 e) 23,200,000 22,600,000 25,100,000 25,200,000 27,500,000 Total net carbon footprint (after applying offsets) 10 (metric tons CO 2 e) 22,530,000 22,530,000 25,100,000 25,200,000 27,500,000 1. Apple is carbon neutral for corporate emissions as of April 2020. 2. Emissions from R&D processes. 3. Beginning in FY2021, we’re accounting for scope 2 emissions from the purchase of district heating, chilled water, and steam. 4. In fiscal year 2017, we started calculating scope 3 emissions not listed in this table. In fiscal year 2021, these include electricity transmission and distribution losses amounted to about 28,000 metric tons CO 2 e and life cycle emissions associated with renewable energy amounted to about 95,000 metric tons CO 2 e. We have not accounted for emissions resulting from employees working from home, because we anticipated these emissions are small relative to our carbon footprint and we are still evolving our methodology. 5. We regularly revisit our methodology to hold ourselves to high accountability standards. So in fiscal year 2018, we changed how we calculate emissions from business travel in order to better account for classes of service in air travel. As a result of this change, our scope 3 transportation emissions increased by 77 percent between 2017 and 2018. Without the methodology change, these emissions would have increased by 14 percent, which reflects the growth in our business. 6. Beginning in fiscal year 2020, we updated our methodology to reflect the impact of COVID-19 on employee commute. 7. We retired 167,000 metric tons of carbon credits from the Chyulu Hills project in Kenya to maintain carbon neutrality for our corporate emissions in fiscal year 2021. This project is certified to the VCS and CCB standards. 8. Because we’re committed to accuracy and transparency, we regularly refine our product life cycle assessment model and sources of data. For example, we recently obtained more granular data summarizing in which countries our products are sold and used, resulting in more granularity possible for grid emission factors used in the carbon footprint of the product use phase. The net result was an increase in our 2021 carbon footprint. When using the same level of data granularity and model as 2021, our product use carbon emissions in 2021 would have been about 2.5 percent lower. 9. For fiscal year 2021, we retired credits from the Chyulu Hills project in Kenya, and purchased carbon credits from two additional projects to offset a total of 500,000 metric tons of direct emissions across our value chain. The first project, a REDD+ coastal conservation project in Guatemala, protects and conserves forests from deforestation and degradation. The second project aims to establish forests on about 46,000 hectares of barren land that is not otherwise in use across seven counties in the Guizhou Province of China. Both projects are certified to the same high standards that we require for projects in the Restore Fund, including VCS and CCBS. These projects are all certified to the VCS and CCB standards. 10. Due to rounding, our gross and net carbon footprints do not always the sum of the subtotals disclosed above. Notes: For data on previous years, please reference past Environmental Progress Reports, available at apple.com/environment. Dash indicates data that are not available. Due to rounding, totals may not be the sum of the subtotals above. Greenhouse gas emissions Environment Appendix Governance Communities Suppliers Customers Our People Environment Introduction Apple’s 2022 ESG Report 78
 ESG Report | Apple Page 77 Page 79