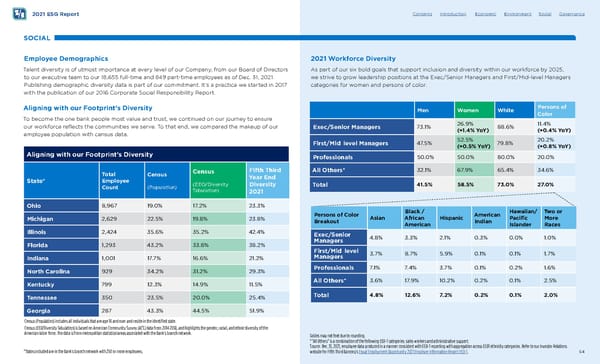
- - 2021 ESG Report SOCIAL Employee Demographics Talent diversity is of utmost importance at every level of our Company, from our Board of Directors to our executive team to our 18,655 full-time and 849 part-time employees as of Dec. 31, 2021. Publishing demographic diversity data is part of our commitment. It’s a practice we started in 2017 with the publication of our 2016 Corporate Social Responsibility Report. Aligning with our Footprint’s Diversity To become the one bank people most value and trust, we continued on our journey to ensure our workforce refects the communities we serve. To that end, we compared the makeup of our employee population with census data. Aligning with our Footprint’s Diversity State* Total Employee Count Census (Population) Census (EEO/Diversity Tabulation) Fifth Third Year End Diversity 2021 Ohio 8,967 19.0% 17. 2 % 23.3% Michigan 2,629 22.5% 19.8% 23.8% Illinois 2,424 35.6% 35.2% 42.4% Florida 1,293 43.2% 33.8% 38.2% Indiana 1,001 17.7 % 16.6% 21.2% North Carolina 929 34.2% 31.2% 29.3% Kentucky 799 12.3% 14.9% 11.5% Tennessee 350 23.5% 20.0% 25.4% Georgia 287 43.3% 44.5% 51.9% Census (Population) includes all individuals that are age 16 and over and reside in the identifed state. Census (EEO/Diversity Tabulation) is based on American Community Survey (ACS) data from 2014-2018, and highlights the gender, racial, and ethnic diversity of the American labor force. The data is from metropolitan statistical areas associated with the Bank’s branch network. *States included are in the Bank’s branch network with 250 or more employees. Contents Introduction Economic Environment Social Governance 2021 Workforce Diversity As part of our six bold goals that support inclusion and diversity within our workforce by 2025, we strive to grow leadership positions at the Exec/Senior Managers and First/Mid-level Managers categories for women and persons of color. 2021 Workforce Diversity Exec/Senior Managers Men Women White Persons of Color 73.1% 26.9% (+1.4% YoY) 88.6% 11.4% (+0.4% YoY) First/Mid level Managers 47. 5% 52.5% (+0. 5% YoY) 79.8% 20.2% (+0. 8% YoY) Professionals 50.0% 50.0% 80.0% 20.0% All Others* 32.1% 67. 9 % 65.4% 34.6% Total 41.5% 58.5% 73.0% 27.0% Persons of Color Breakout Asian Black / African American Hispanic American Indian Hawaiian/ Pacifc Islander Two or More Races Exec/Senior Managers 4.8% 3.3% 2.1% 0.3% 0.0% 1.0% First/Mid level Managers 3.7% 8.7% 5.9% 0.1% 0.1% 1.7% Professionals 7.1% 7. 4% 3.7% 0.1% 0.2% 1.6% All Others* 3.6% 17. 9 % 10.2% 0.2% 0.1% 2.5% Total 4.8% 12.6% 7. 2% 0.2% 0.1% 2.0% Tables may not foot due to rounding. *”All Others” is a combination of the following EEO-1 categories: sales workers and administrative support. Source: Dec. 31, 2021, employee data produced in a manner consistent with EEO-1 reporting with aggregation across EEO1 ethnicity categories. Refer to our Investor Relations website for Fifth Third Bancorp’s Equal Employment Opportunity 2021 Employer Information Report EEO-1 . 54
 Fifth Third ESG Report Page 53 Page 55