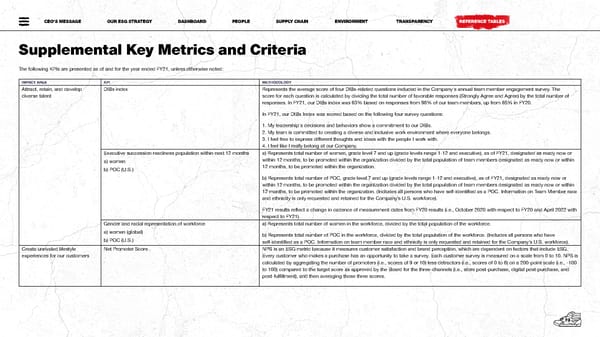
CEO’S MESSAGE OUR ESG STRATEGY DASHBOARD PEOPLE SUPPLY CHAIN ENVIRONMENT TRANSPARENCY REFERENCE TABLES Supplemental Key Metrics and Criteria The following KPIs are presented as of and for the year ended FY21, unless otherwise noted: IMPACT AREA KPI METHODOLOGY Attract, retain, and develop DIBs index Represents the average score of four DIBs-related questions included in the Company's annual team member engagement survey. The diverse talent score for each question is calculated by dividing the total number of favorable responses (Strongly Agree and Agree) by the total number of responses. In FY21, our DIBs index was 83% based on responses from 96% of our team members, up from 85% in FY20. In FY21, our DIBs Index was scored based on the following four survey questions: 1. My leadership's decisions and behaviors show a commitment to our DIBs. 2. My team is committed to creating a diverse and inclusive work environment where everyone belongs. 3. I feel free to express different thoughts and ideas with the people I work with. 4. I feel like I really belong at our Company. Executive succession readiness population within next 12 months a) Represents total number of women, grade level 7 and up (grade levels range 1-12 and executive), as of FY21, designated as ready now or a) women within 12 months, to be promoted within the organization divided by the total population of team members designated as ready now or within b) POC (U.S.) 12 months, to be promoted within the organization. b) Represents total number of POC, grade level 7 and up (grade levels range 1-12 and executive), as of FY21, designated as ready now or within 12 months, to be promoted within the organization divided by the total population of team members designated as ready now or within 12 months, to be promoted within the organization. (Includes all persons who have self-identified as a POC. Information on Team Member race and ethnicity is only requested and retained for the Company’s U.S. workforce). FY21 results reflect a change in cadence of measurement dates from FY20 results (i.e., October 2020 with respect to FY20 and April 2022 with respect to FY21). Gender and racial representation of workforce a) Represents total number of women in the workforce, divided by the total population of the workforce. a) women (global) b) Represents total number of POC in the workforce, divided by the total population of the workforce. (Includes all persons who have b) POC (U.S.) self-identified as a POC. Information on team member race and ethnicity is only requested and retained for the Company’s U.S. workforce). Create unrivaled lifestyle Net Promoter Score NPS is an ESG metric because it measures customer satisfaction and brand perception, which are dependent on factors that include ESG. experiences for our customers Every customer who makes a purchase has an opportunity to take a survey. Each customer survey is measured on a scale from 0 to 10. NPS is calculated by aggregating the number of promoters (i.e., scores of 9 or 10) less detractors (i.e., scores of 0 to 6) on a 200-point scale (i.e., -100 to 100) compared to the target score as approved by the Board for the three-channels (i.e., store post-purchase, digital post-purchase, and post-fulfillment), and then averaging those three scores. 7373
 Footlocker Impact Report Page 74 Page 76