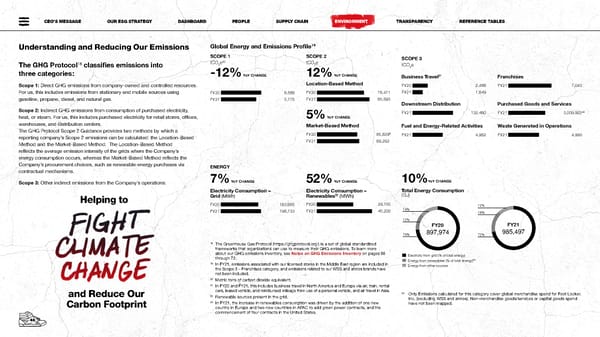
CEO’S MESSAGE OUR ESG STRATEGY DASHBOARD PEOPLE SUPPLY CHAIN ENVIRONMENT TRANSPARENCY REFERENCE TABLES Understanding and Reducing Our Emissions Global Energy and Emissions Profile19 SCOPE 1 SCOPE 2 SCOPE 3 18 tCO e20 tCO e The GHG Protocol classifies emissions into 2 2 tCO e 2 three categories: -12% YoY CHANGE 12% YoY CHANGE 21 Business Travel Franchises Scope 1: Direct GHG emissions from company-owned and controlled resources. Location-Based Method FY20 2,486 FY21 7,040 For us, this includes emissions from stationary and mobile sources using FY20 6,588 FY20 76,471 FY21 1,649 6,588 gasoline, propane, diesel, and natural gas. FY21 5,775 FY21 85,893 Downstream Distribution Purchased Goods and Services Scope 2: Indirect GHG emissions from consumption of purchased electricity, 5% YoY CHANGE FY21 132,460 FY21 3,009,92224 heat, or steam. For us, this includes purchased electricity for retail stores, offices, warehouses, and distribution centers. Market-Based Method Fuel and Energy-Related Activities Waste Generated in Operations The GHG Protocol Scope 2 Guidance provides two methods by which a 6 reporting company’s Scope 2 emissions can be calculated: the Location-Based FY20 65,839 FY21 4,962 FY21 4,990 Method and the Market-Based Method. The Location-Based Method FY21 69,292 reflects the average emission intensity of the grids where the Company’s energy consumption occurs, whereas the Market-Based Method reflects the Company’s procurement choices, such as renewable-energy purchases via ENERGY contractual mechanisms. 7% YoY CHANGE 52% YoY CHANGE 10%YoY CHANGE Scope 3: Other indirect emissions from the Company’s operations. Electricity Consumption – Electricity Consumption – Total Energy Consumption (MWh) 22 (MWh) (GJ) Helping to Grid Renewables FY20 183,665 FY20 29,755 12% FY21 196,733 FY21 45,200 14% 16% 12% FY20 FY21 74% 897,974 72% 985,497 18 The Greenhouse Gas Protocol (https://ghgprotocol.org/) is a set of global standardized frameworks that organizations can use to measure their GHG emissions. To learn more about our GHG emissions inventory, see Notes on GHG Emissions Inventory on pages 66 Electricity from grid (% of total energy) through 72. 23 Energy from renewables (% of total energy) 19 In FY21, emissions associated with our licensed stores in the Middle East region are included in Energy from other sources the Scope 3 – Franchises category, and emissions related to our WSS and atmos brands have not been included. 20 Metric tons of carbon dioxide equivalent. 21 In FY20 and FY21, this includes business travel in North America and Europe via air, train, rental cars, leased vehicle, and reimbursed mileage from use of a personal vehicle, and air travel in Asia. 24 Only Emissions calculated for this category cover global merchandise spend for Foot Locker, and Reduce Our 22 Renewable sources present in the grid. Inc. (excluding WSS and atmos). Non-merchandise goods/services or capital goods spend Carbon Footprint 23 In FY21, the increase in renewables consumption was driven by the addition of one new have not been mapped. country in Europe and two new countries in APAC to add green power contracts, and the commencement of four contracts in the United States. 4646
 Footlocker Impact Report Page 47 Page 49