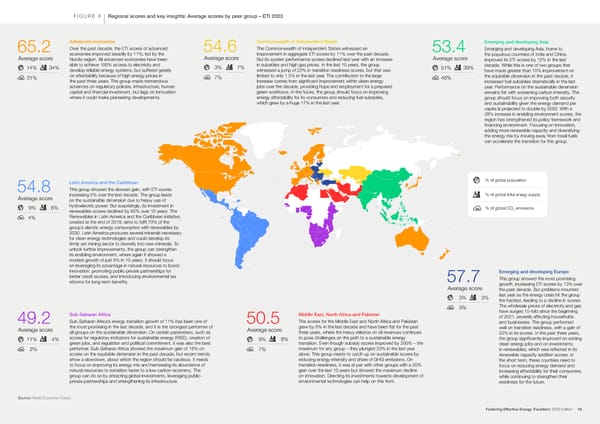
FIGURE 6 Regional scores and key insights: Average scores by peer group – ETI 2023 Advanced economies Commonwealth of Independent States Emerging and developing Asia 65.2 Over the past decade, the ETI scores of advanced 54.6 The Commonwealth of Independent States witnessed an 53.4 Emerging and developing Asia, home to Average score economies improved steadily by 11%, led by the Average score improvement in aggregate ETI scores by 11% over the past decade. Average score the populous countries of India and China, Nordic region. All advanced economies have been But its system performance scores declined last year with an increase improved its ETI scores by 12% in the last 14% 34% able to achieve 100% access to electricity and 3% 7% in subsidies and high gas prices. In the last 10 years, the group 51% 39% decade. While this is one of two groups that develop reliable energy systems, but suffered greatly witnessed a jump of 22% in transition readiness scores, but that was have made greater than 10% improvement on 31% on affordability because of high energy prices in 7% limited to only 1.5% in the last year. The contribution to the large 46% the equitable dimension in the past decade, it the past three years. The group made tremendous increase comes from signi昀椀cant improvement within clean energy increased fuel subsidies dramatically in the last advances on regulatory policies, infrastructure, human jobs over the decade, providing hope and employment for a prepared year. Performance on the sustainable dimension capital and 昀椀nancial investment, but lags on innovation green workforce. In the future, the group should focus on improving remains 昀氀at with worsening carbon intensity. The where it could make pioneering developments. energy affordability for its consumers and reducing fuel subsidies, group should focus on improving both security which grew by a huge 17% in the last year. and sustainability given the energy demand per capita is projected to double by 2050. With a 28% increase in enabling environment scores, the region has strengthened its policy framework and 昀椀nancing environment. Focusing on innovation, adding more renewable capacity and diversifying the energy mix by moving away from fossil fuels can accelerate the transition for this group. Latin America and the Caribbean % of global population 54.8 This group showed the slowest gain, with ETI scores Average score increasing 5% over the last decade. The group leads % of global total enegy supply on the sustainable dimension due to heavy use of 9% 6% hydroelectric power. But surprisingly, its investment in % of global CO emissions renewables scores declined by 65% over 10 years. The 2 4% Renewables in Latin America and the Caribbean initiative, created at the end of 2019, aims to ful昀椀l 70% of the group’s electric energy consumption with renewables by 2030. Latin America produces several minerals necessary for clean energy technologies and could develop its 昀椀rmly set mining sector to diversify into new minerals. To unlock further improvements, the group can strengthen its enabling environment, where again it showed a modest growth of just 8% in 10 years. It should focus on leveraging its advantage in natural resources to boost innovation, promoting public-private partnerships for Emerging and developing Europe better credit access, and introducing environmental tax 57.7 This group showed the most promising reforms for long-term bene昀椀ts. growth, increasing ETI scores by 13% over Average score the past decade. But problems mounted 3% 3% last year as the energy crisis hit the group the hardest, leading to a decline in scores. 3% The wholesale prices of electricity and gas Sub-Saharan Africa Middle East, North Africa and Pakistan have surged 15-fold since the beginning of 2021, severely affecting households 49.2 Sub-Saharan Africa’s energy transition growth of 11% has been one of 50.5 The scores for the Middle East and North Africa and Pakistan and businesses. The group performed Average score the most promising in the last decade, and it is the strongest performer of Average score grew by 8% in the last decade and have been 昀氀at for the past well on transition readiness, with a gain of all groups on the sustainable dimension. On certain parameters, such as three years, where the heavy reliance on oil revenues continues 22% in its scores. In the past three years, 11% 4% scores for regulatory indicators for sustainable energy (RISE), creation of 9% 8% to pose challenges on the path to a sustainable energy the group signi昀椀cantly improved on adding green jobs, and regulation and political commitment, it was also the best transition. Even though subsidy scores improved by 200% – the clean energy jobs and on investments 2% performer. Sub-Saharan Africa showed the maximum gain of 18% on 7% maximum for any group – they plunged 33% in the last year in renewables, which was re昀氀ected in its scores on the equitable dimension in the past decade, but recent trends alone. This group needs to catch up on sustainable scores by renewable capacity addition scores. In show a slowdown, about which the region should be cautious. It needs reducing energy intensity and share of GHG emissions. On the short term, these countries need to to focus on improving its energy mix and harnessing its abundance of transition readiness, it was at par with other groups with a 20% focus on reducing energy demand and natural resources to transition faster to a low-carbon economy. The gain over the last 10 years but showed the maximum decline increasing affordability for their consumers, group can do so by attracting global investments, leveraging public- on innovation. Directing its investments towards development of while continuing to strengthen their private partnerships and strengthening its infrastructure. environmental technologies can help on this front. readiness for the future. Source: World Economic Forum Fostering Effective Energy Transition: 2023 Edition 18
 Fostering Effective Energy Transition 2023 Page 17 Page 19