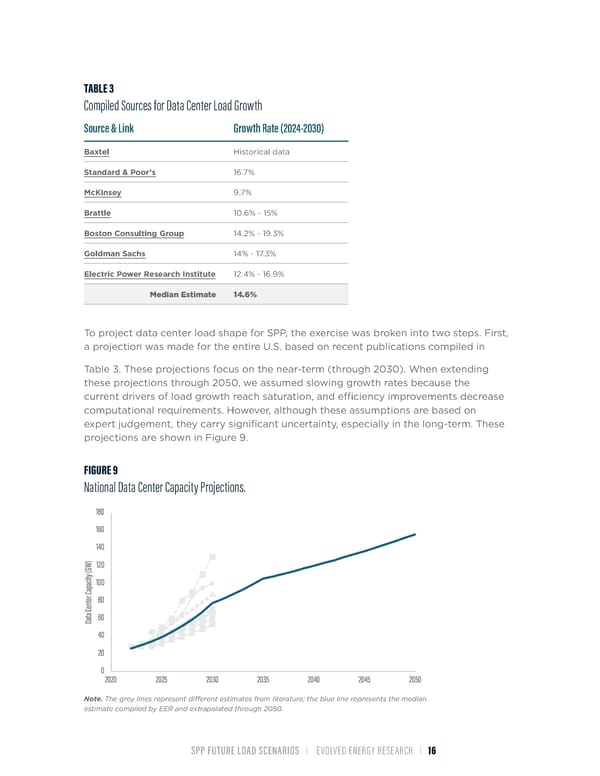
TABLE 3 Compiled Sources for Data Center Load Growth Source & Link Growth Rate (2024-2030) Baxtel Historical data Standard & Poor’s 16.7% McKinsey 9.7% Brattle 10.6% - 15% Boston Consulting Group 14.2% - 19.3% Goldman Sachs 14% - 17.3% Electric Power Research Institute 12.4% - 16.9% Median Estimate 14.6% To project data center load shape for SPP, the exercise was broken into two steps. First, a projection was made for the entire U.S. based on recent publications compiled in Table 3. These projections focus on the near-term (through 2030). When extending these projections through 2050, we assumed slowing growth rates because the current drivers of load growth reach saturation, and efÏciency improvements decrease computational requirements. However, although these assumptions are based on expert judgement, they carry significant uncertainty, especially in the long-term. These projections are shown in Figure 9. FIGURE 9 National Data Center Capacity Projections. Note. The grey lines represent different estimates from literature; the blue line represents the median estimate compiled by EER and extrapolated through 2050. SPP FUTURE LOAD SCENARIOS | EVOLVED ENERGY RESEARCH | 16
 Future Load Scenarios for Southwest Power Pool Page 17 Page 19