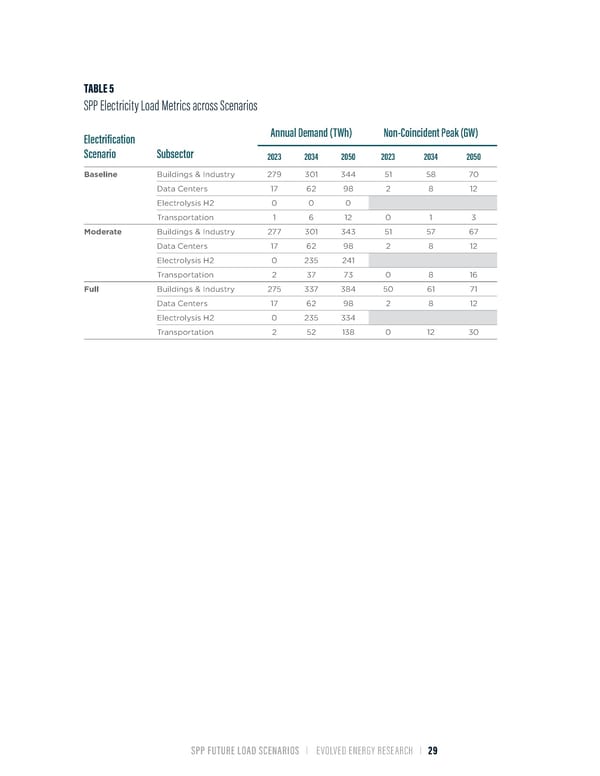
TABLE 5 SPP Electricity Load Metrics across Scenarios Electrification Annual Demand (TWh) Non-Coincident Peak (GW) Scenario Subsector 2023 2034 2050 2023 2034 2050 Baseline Buildings & Industry 279 301 344 51 58 70 Data Centers 17 62 98 2 8 12 Electrolysis H2 0 0 0 Transportation 1 6 12 0 1 3 Moderate Buildings & Industry 277 301 343 51 57 67 Data Centers 17 62 98 2 8 12 Electrolysis H2 0 235 241 Transportation 2 37 73 0 8 16 Full Buildings & Industry 275 337 384 50 61 71 Data Centers 17 62 98 2 8 12 Electrolysis H2 0 235 334 Transportation 2 52 138 0 12 30 SPP FUTURE LOAD SCENARIOS | EVOLVED ENERGY RESEARCH | 29
 Future Load Scenarios for Southwest Power Pool Page 30 Page 32