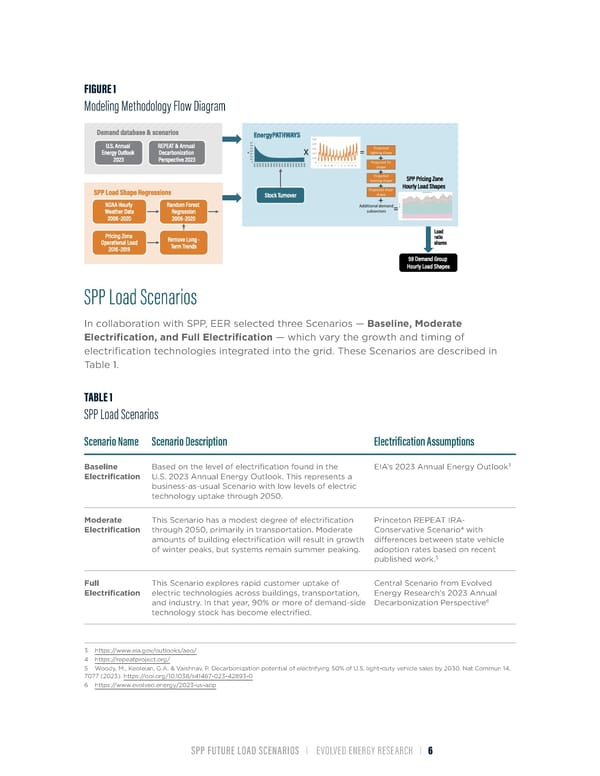
FIGURE 1 Modeling Methodology Flow Diagram SPP Load Scenarios In collaboration with SPP, EER selected three Scenarios — Baseline, Moderate Electrification, and Full Electrification — which vary the growth and timing of electrification technologies integrated into the grid. These Scenarios are described in Table 1. TABLE 1 SPP Load Scenarios Scenario Name Scenario Description Electrification Assumptions 3 Baseline Based on the level of electrification found in the EIA’s 2023 Annual Energy Outlook Electrification U.S. 2023 Annual Energy Outlook. This represents a business-as-usual Scenario with low levels of electric technology uptake through 2050. Moderate This Scenario has a modest degree of electrification Princeton REPEAT IRA- 4 Electrification through 2050, primarily in transportation. Moderate Conservative Scenario with amounts of building electrification will result in growth differences between state vehicle of winter peaks, but systems remain summer peaking. adoption rates based on recent 5 published work. Full This Scenario explores rapid customer uptake of Central Scenario from Evolved Electrification electric technologies across buildings, transportation, Energy Research’s 2023 Annual 6 and industry. In that year, 90% or more of demand-side Decarbonization Perspective technology stock has become electrified. 3 https://www.eia.gov/outlooks/aeo/ 4 https://repeatproject.org/ 5 Woody, M., Keoleian, G.A. & Vaishnav, P. Decarbonization potential of electrifying 50% of U.S. light-duty vehicle sales by 2030. Nat Commun 14, 7077 (2023). https://doi.org/10.1038/s41467-023-42893-0 6 https://www.evolved.energy/2023-us-adp SPP FUTURE LOAD SCENARIOS | EVOLVED ENERGY RESEARCH | 6
 Future Load Scenarios for Southwest Power Pool Page 7 Page 9