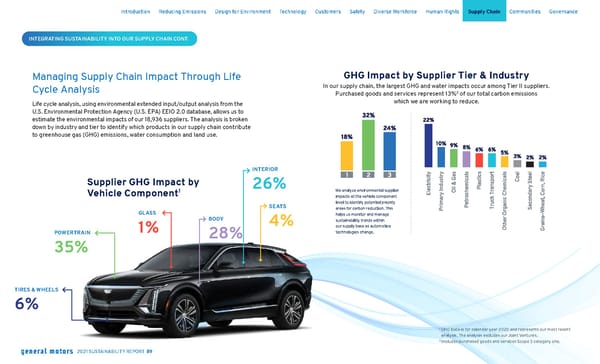
INTEGRATING SUSTAINABILITY INTO OUR SUPPLY CHAIN CONT. Managing Supply Chain Impact Through Life Cycle Analysis Life cycle analysis, using environmental extended input/output analysis from the U.S. Environmental Protection Agency (U.S. EPA) EEIO 2.0 database, allows us to estimate the environmental impacts of our 18,936 suppliers. The analysis is broken down by industry and tier to identify which products in our supply chain contribute to greenhouse gas (GHG) emissions, water consumption and land use. GHG Impact by Supplier Tier & Industry In our supply chain, the largest GHG and water impacts occur among Tier II suppliers. Purchased goods and services represent 13% 2 of our total carbon emissions which we are working to reduce. We analyze environmental supplier impacts at the vehicle component level to identify potential priority areas for carbon reduction. This helps us monitor and manage sustainability trends within our supply base as automotive technologies change. Supplier GHG Impact by Vehicle Component 1 TIRES & WHEELS 6% POWERTRAIN 35% GLASS 1% BODY 28% INTERIOR 26% S E AT S 4% 1 G HG Data is for calendar year 2020 and represents our most recent analysis. The analysis excludes our Joint Ventures. 2 Inc ludes purchased goods and services Scope 3 category one. Skip Navigation Introduction Reducing Emissions Design for Environment Technology Customers Safety Diverse Workforce Human Rights Supply Chain Communities Governance 2021 SUSTAINABILITY REPORT 89
 General Motors Sustainability Report Page 89 Page 91