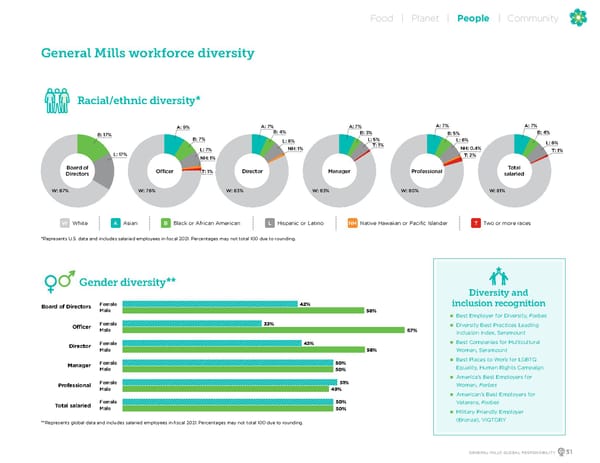
General Mills workforce diversity *Represents U.S. data and includes salaried employees in fiscal 2021. Percentages may not total 100 due to rounding. White W Asian A Black or African American B Hispanic or Latino L Native Hawaiian or Pacific Islander NH Two or more races T Board of Directors Total salaried Officer W: 76% W: 67% W: 83% W: 83% W: 80% W: 81% A: 7% A: 9% A: 7% A: 7% A: 7% B: 4% B: 7% B: 17% B: 5% B: 3% B: 4% L: 6% L: 7% L: 17% L: 6% L: 5% L: 6% T: 1% NH: 1% NH: 1% NH: 0.4% T: 1% T: 2% T: 1% Director Manager Professional Racial/ethnic diversity * Gender diversity ** **Represents global data and includes salaried employees in fiscal 2021. Percentages may not total 100 due to rounding. Female Male 33% 67% Officer Female Male 51% 49% Professional Female Male 42% 58% Board of Directors Female Male 50% 50% Total salaried Female Male 43% 58% Director Female Male 50% 50% Manager Diversity and inclusion recognition n Best Employer for Diversity, Forbes n Diversity Best Practices Leading Inclusion Index, Seramount n Best Companies for Multicultural Women, Seramount n Best Places to Work for LGBTQ Equality, Human Rights Campaign n America’s Best Employers for Women, Forbes n American’s Best Employers for Veterans, Forbes n Military Friendly Employer (Bronze), VIQTORY GENERAL MILLS GLOBAL RESPONSIBILITY 51 Food Planet People Community
 GeneralMills Global Responsibility Report Page 52 Page 54