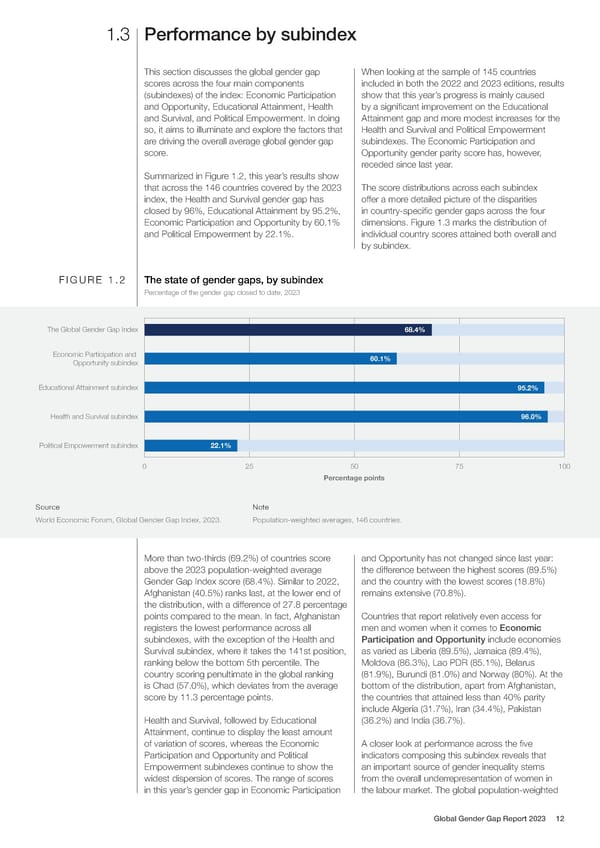
1.3 Performance by subindex This section discusses the global gender gap When looking at the sample of 145 countries scores across the four main components included in both the 2022 and 2023 editions, results (subindexes) of the index: Economic Participation show that this year’s progress is mainly caused and Opportunity, Educational Attainment, Health by a signi昀椀cant improvement on the Educational and Survival, and Political Empowerment. In doing Attainment gap and more modest increases for the so, it aims to illuminate and explore the factors that Health and Survival and Political Empowerment are driving the overall average global gender gap subindexes. The Economic Participation and score. Opportunity gender parity score has, however, receded since last year. Summarized in Figure 1.2, this year’s results show that across the 146 countries covered by the 2023 The score distributions across each subindex index, the Health and Survival gender gap has offer a more detailed picture of the disparities closed by 96%, Educational Attainment by 95.2%, in country-speci昀椀c gender gaps across the four Economic Participation and Opportunity by 60.1% dimensions. Figure 1.3 marks the distribution of and Political Empowerment by 22.1%. individual country scores attained both overall and by subindex. FIGURE 1.2 The state of gender gaps, by subindex Percentage of the gender gap closed to date, 2023 The Global Gender Gap Index 68.4% Economic Participation and 60.1% Opportunity subindex Educational Attainment subindex 95.2% Health and Survival subindex 96.0% Political Empowerment subindex 22.1% 0 25 50 75 100 Percentage points Source Note World Economic Forum, Global Gender Gap Index, 2023. Population-weighted averages, 146 countries. More than two-thirds (69.2%) of countries score and Opportunity has not changed since last year: above the 2023 population-weighted average the difference between the highest scores (89.5%) Gender Gap Index score (68.4%). Similar to 2022, and the country with the lowest scores (18.8%) Afghanistan (40.5%) ranks last, at the lower end of remains extensive (70.8%). the distribution, with a difference of 27.8 percentage points compared to the mean. In fact, Afghanistan Countries that report relatively even access for registers the lowest performance across all men and women when it comes to Economic subindexes, with the exception of the Health and Participation and Opportunity include economies Survival subindex, where it takes the 141st position, as varied as Liberia (89.5%), Jamaica (89.4%), ranking below the bottom 5th percentile. The Moldova (86.3%), Lao PDR (85.1%), Belarus country scoring penultimate in the global ranking (81.9%), Burundi (81.0%) and Norway (80%). At the is Chad (57.0%), which deviates from the average bottom of the distribution, apart from Afghanistan, score by 11.3 percentage points. the countries that attained less than 40% parity include Algeria (31.7%), Iran (34.4%), Pakistan Health and Survival, followed by Educational (36.2%) and India (36.7%). Attainment, continue to display the least amount of variation of scores, whereas the Economic A closer look at performance across the 昀椀ve Participation and Opportunity and Political indicators composing this subindex reveals that Empowerment subindexes continue to show the an important source of gender inequality stems widest dispersion of scores. The range of scores from the overall underrepresentation of women in in this year’s gender gap in Economic Participation the labour market. The global population-weighted Global Gender Gap Report 2023 12
 Global Gender Gap Report 2023 Page 11 Page 13