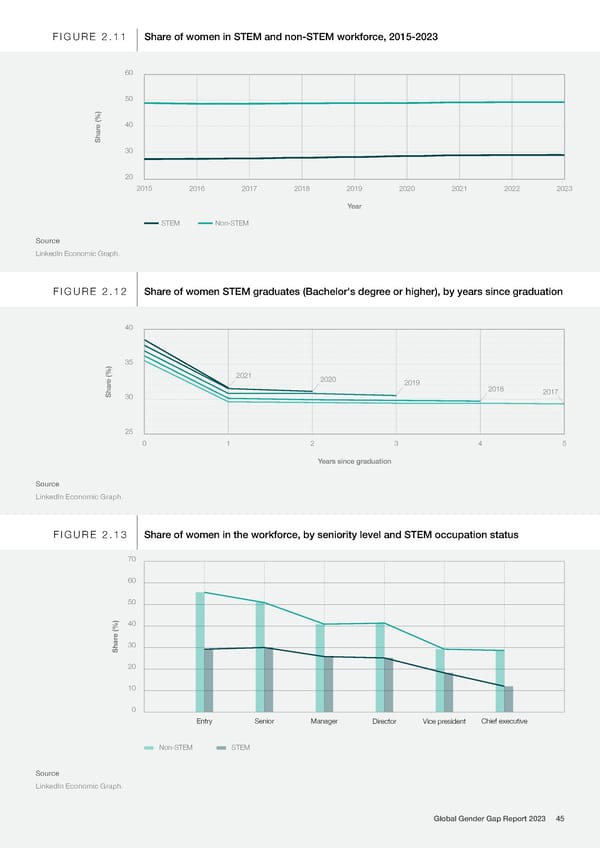
FIGURE 2.11 Share of women in STEM and non-STEM workforce, 2015-2023 60 50 e (%) 40 Shar 30 20 2015 2016 2017 2018 2019 2020 2021 2022 2023 Year STEM Non-STEM Source LinkedIn Economic Graph. FIGURE 2.12 Share of women STEM graduates (Bachelor's degree or higher), by years since graduation 40 35 e (%) 2021 2020 2019 Shar 2018 2017 30 25 0 1 2 3 4 5 Years since graduation Source LinkedIn Economic Graph. FIGURE 2.13 Share of women in the workforce, by seniority level and STEM occupation status 70 60 50 40 e (%) Shar30 20 10 0 Entry Senior Manager Director Vice president Chief executive Non-STEM STEM Source LinkedIn Economic Graph. Global Gender Gap Report 2023 45
 Global Gender Gap Report 2023 Page 44 Page 46