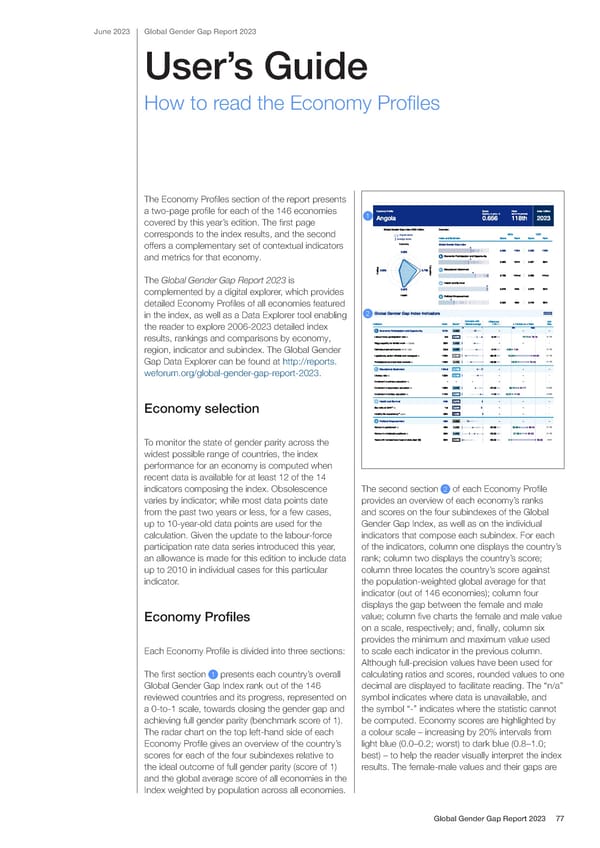
June 2023 Global Gender Gap Report 2023 User’s Guide How to read the Economy Pro昀椀les The Economy Pro昀椀les section of the report presents a two-page pro昀椀le for each of the 146 economies Economy Profile Score Rank Index Edition 1 (imparity = 0, parity = 1) (out of 146 countries) covered by this year’s edition. The 昀椀rst page Angola 0.656 118th 2023 Global Gender Gap Index 2023 Edition Overview 2023 2022 corresponds to the index results, and the second Angola score Index and Subindex Score Rank Score Rank average score Economy offers a complementary set of contextual indicators Global Gender Gap Index 0.656 118th 0.638 125th 0.605 and metrics for that economy. Economic Participation and Opportunity 0.605 107th 0.637 99th E d s u c c i Educational Attainment t a i 0.305 0.738 l t i o o P n The Global Gender Gap Report 2023 is 0.738 142nd 0.693 142nd Health and Survival 0.976 44th 0.976 50th complemented by a digital explorer, which provides 0.976 Health Political Empowerment detailed Economy Pro昀椀les of all economies featured 0.305 46th 0.246 59th in the index, as well as a Data Explorer tool enabling 2 Global Gender Gap Index Indicators 2023 Compare with Difference Min Global average Indicator Rank Score* F-M Female vs Male Max the reader to explore 2006-2023 detailed index 0 1 Min Max Economic Participation and Opportunity 107th 0.605 - - - 0-100 results, rankings and comparisons by economy, Labour-force participation rate % 3rd 0.956 -3.44 74.72 78.16 - Wage equality for similar work 1-7 (best) 95th 0.600 - - 0-150 region, indicator and subindex. The Global Gender Estimated earned income int'l $ 1,000 53rd 0.682 -2.24 4.80 7.04 0-100 Legislators, senior officials and managers % 126th 0.181 -69.28 15.36 84.64 0-100 Gap Data Explorer can be found at http://reports. Professional and technical workers % 126th 0.420 -40.86 29.57 70.43 Educational Attainment 142nd 0.738 - - - weforum.org/global-gender-gap-report-2023. - Literacy rate % 130th 0.755 - - - Enrolment in primary education % - - - - - 0-200 Enrolment in secondary education % 138th 0.643 -22.03 39.74 61.77 0-200 Enrolment in tertiary education % 112th 0.889 -1.25 10.01 11.26 Health and Survival 44th 0.976 - - - - Economy selection Sex ratio at birth** % 1st 0.944 - - - Healthy life expectancy** years 56th 1.050 - - Political Empowerment 46th 0.305 - - - 0-100 Women in parliament % 46th 0.506 -32.80 33.60 66.40 0-100 Women in ministerial positions % 30th 0.600 -25.00 37.50 62.50 0-50 To monitor the state of gender parity across the Years with female/male head of state (last 50) 80th 0.000 -50.00 0 50.00 widest possible range of countries, the index performance for an economy is computed when recent data is available for at least 12 of the 14 indicators composing the index. Obsolescence The second section 2 of each Economy Pro昀椀le varies by indicator; while most data points date provides an overview of each economy’s ranks from the past two years or less, for a few cases, and scores on the four subindexes of the Global up to 10-year-old data points are used for the Gender Gap Index, as well as on the individual calculation. Given the update to the labour-force indicators that compose each subindex. For each participation rate data series introduced this year, of the indicators, column one displays the country’s an allowance is made for this edition to include data rank; column two displays the country’s score; up to 2010 in individual cases for this particular column three locates the country’s score against indicator. the population-weighted global average for that indicator (out of 146 economies); column four displays the gap between the female and male Economy Pro昀椀les value; column 昀椀ve charts the female and male value on a scale, respectively; and, 昀椀nally, column six provides the minimum and maximum value used Each Economy Pro昀椀le is divided into three sections: to scale each indicator in the previous column. Although full-precision values have been used for The 昀椀rst section 1 presents each country’s overall calculating ratios and scores, rounded values to one Global Gender Gap Index rank out of the 146 decimal are displayed to facilitate reading. The “n/a” reviewed countries and its progress, represented on symbol indicates where data is unavailable, and a 0-to-1 scale, towards closing the gender gap and the symbol “-” indicates where the statistic cannot achieving full gender parity (benchmark score of 1). be computed. Economy scores are highlighted by The radar chart on the top left-hand side of each a colour scale – increasing by 20% intervals from Economy Pro昀椀le gives an overview of the country’s light blue (0.0–0.2; worst) to dark blue (0.8–1.0; scores for each of the four subindexes relative to best) – to help the reader visually interpret the index the ideal outcome of full gender parity (score of 1) results. The female-male values and their gaps are and the global average score of all economies in the Index weighted by population across all economies. Global Gender Gap Report 2023 77
 Global Gender Gap Report 2023 Page 76 Page 78