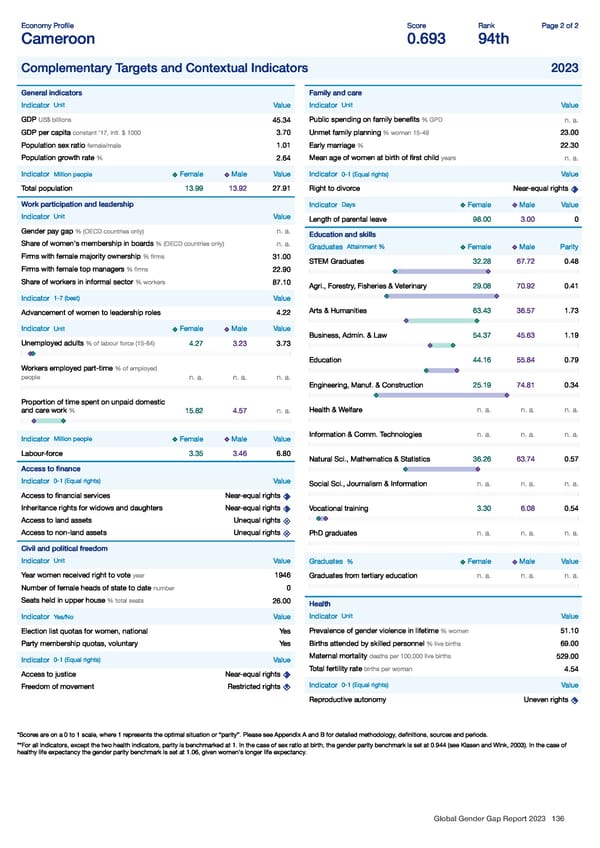
Economy Profile Score Rank Page 2 of 2 Cameroon 0.693 94th Complementary Targets and Contextual Indicators 2023 General indicators Family and care Unit Unit Indicator Value Indicator Value GDPUS$ billions Public spending on family benefits % GPD 45.34 n. a. GDP per capita constant '17, intl. $ 1000 3.70 Unmet family planning % women 15-49 23.00 Population sex ratio female/male 1.01 Early marriage % 22.30 Population growth rate % Mean age of women at birth of first child years 2.64 n. a. Indicator Million people Female Male Value Indicator 0-1 (Equal rights) Value Total population 13.99 13.92 27.91 Right to divorce Near-equal rights Work participation and leadership Days Indicator Female Male Value Unit Indicator Value Length of parental leave 98.00 3.00 0 Gender pay gap % (OECD countries only) n. a. Education and skills Share of women's membership in boards % (OECD countries only) n. a. Attainment % Graduates Female Male Parity Firms with female majority ownership % firms 31.00 STEM Graduates 32.28 67.72 0.48 Firms with female top managers % firms 22.90 Share of workers in informal sector % workers 87.10 Agri., Forestry, Fisheries & Veterinary 29.08 70.92 0.41 1-7 (best) Indicator Value Arts & Humanities 63.43 36.57 1.73 Advancement of women to leadership roles 4.22 Indicator Unit Female Male Value Business, Admin. & Law 54.37 45.63 1.19 Unemployed adults % of labour force (15-64) 4.27 3.23 3.73 Education 44.16 55.84 0.79 Workers employed part-time % of employed people n. a. n. a. n. a. Engineering, Manuf. & Construction 25.19 74.81 0.34 Proportion of time spent on unpaid domestic Health & Welfare n. a. n. a. n. a. and care work % 15.82 4.57 n. a. Information & Comm. Technologies n. a. n. a. n. a. Million people Indicator Female Male Value Labour-force 3.35 3.46 6.80 Natural Sci., Mathematics & Statistics 36.26 63.74 0.57 Access to finance 0-1 (Equal rights) Indicator Value Social Sci., Journalism & Information n. a. n. a. n. a. Access to financial services Near-equal rights Inheritance rights for widows and daughters Near-equal rights Vocational training 3.30 6.08 0.54 Access to land assets Unequal rights Access to non-land assets Unequal rights PhD graduates n. a. n. a. n. a. Civil and political freedom Unit Indicator Value Graduates % Female Male Value Year women received right to vote year 1946 Graduates from tertiary education n. a. n. a. n. a. Number of female heads of state to date number 0 Seats held in upper house % total seats 26.00 Health Unit Indicator Value Indicator Yes/No Value Prevalence of gender violence in lifetime % women 51.10 Election list quotas for women, national Yes Party membership quotas, voluntary Yes Births attended by skilled personnel % live births 69.00 Maternal mortality deaths per 100,000 live births 529.00 0-1 (Equal rights) Indicator Value Total fertility rate births per woman 4.54 Access to justice Near-equal rights 0-1 (Equal rights) Indicator Value Freedom of movement Restricted rights Reproductive autonomy Uneven rights *Scores are on a 0 to 1 scale, where 1 represents the optimal situation or “parity”. Please see Appendix A and B for detailed methodology, definitions, sources and periods. **For all indicators, except the two health indicators, parity is benchmarked at 1. In the case of sex ratio at birth, the gender parity benchmark is set at 0.944 (see Klasen and Wink, 2003). In the case of healthy life expectancy the gender parity benchmark is set at 1.06, given women's longer life expectancy. Global Gender Gap Report 2023 136
 Global Gender Gap Report 2023 Page 135 Page 137