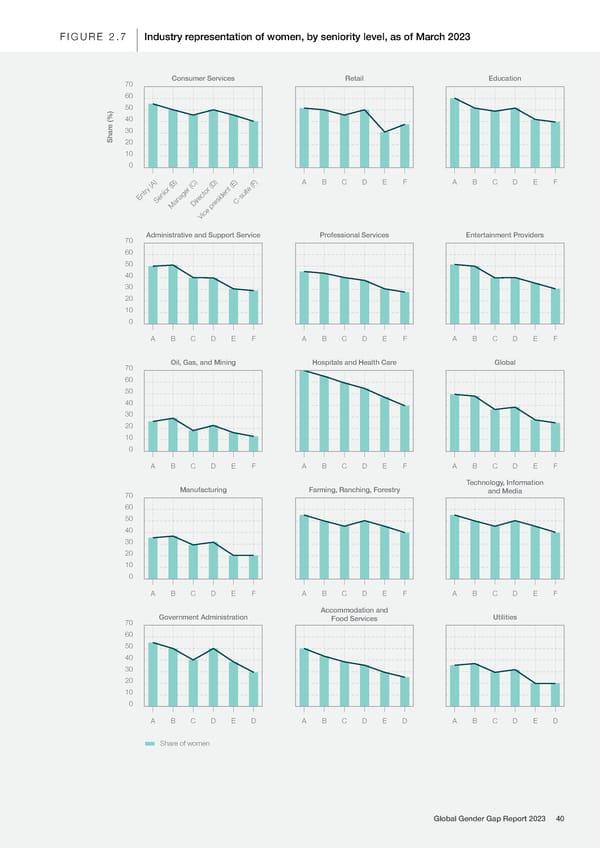
FIGURE 2.7 Industry representation of women, by seniority level, as of March 2023 70 Consumer Services Retail Education 60 50 e (%) 40 30 Shar 20 10 0 A B C D E F A B C D E F Entry (A) ector (D) Senior (B) C-suite (F) Dir esident (E) Manager (C) Vice pr 70 Administrative and Support Service Professional Services Entertainment Providers 60 50 40 30 20 10 0 A B C D E F A B C D E F A B C D E F 70 Oil, Gas, and Mining Hospitals and Health Care Global 60 50 40 30 20 10 0 A B C D E F A B C D E F A B C D E F Technology, Information 70 Manufacturing Farming, Ranching, Forestry and Media 60 50 40 30 20 10 0 A B C D E F A B C D E F A B C D E F Accommodation and 70 Government Administration Food Services Utilities 60 50 40 30 20 10 0 A B C D E D A B C D E D A B C D E D Share of women Global Gender Gap Report 2023 40
 Global Gender Gap Report 2023 Page 39 Page 41