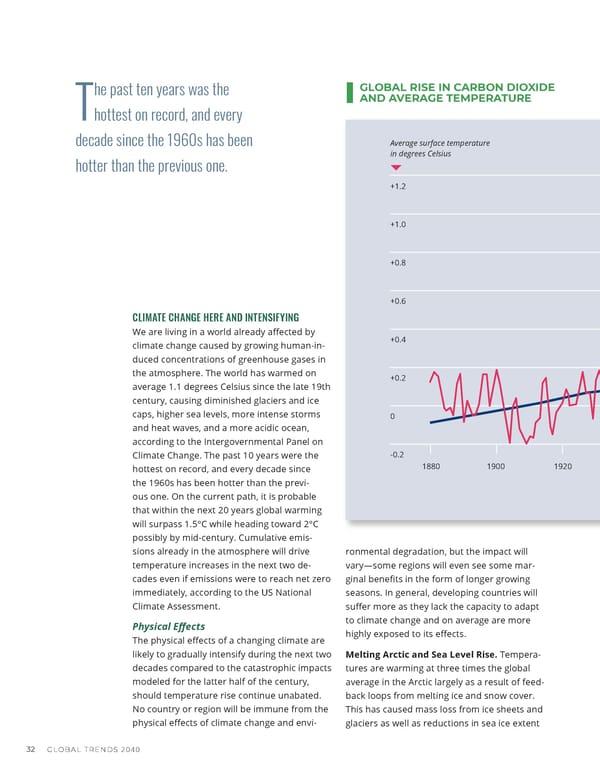
he past ten years was the GLOBAL RISE IN CARBON DIOXIDE Thottest on record, and every AND AVERAGE TEMPERATURE This graph illustrates the decade since the 1960s has been Average surface temperature Atmospheric CO2 concentrations change in global carbon dioxide in degrees Celsius in parts per million concentrations in atmospheric hotter than the previous one. parts per million and in global surface temperature in degrees +1.2 420 Celsius relative to pre-Industrial average temperatures. Nineteen of the 20 warmest years have +1.0 400 occurred since 2001, and 2020 tied TEMPERATURE for the hottest year on record. +0.8 380 +0.6 CARBON 360 CLIMATE CHANGE HERE AND INTENSIFYING DIOXIDE We are living in a world already a昀昀ected by +0.4 340 climate change caused by growing human-in- duced concentrations of greenhouse gases in the atmosphere. The world has warmed on +0.2 320 average 1.1 degrees Celsius since the late 19th century, causing diminished glaciers and ice caps, higher sea levels, more intense storms 0 300 and heat waves, and a more acidic ocean, according to the Intergovernmental Panel on Climate Change. The past 10 years were the -0.2 280 hottest on record, and every decade since 1880 1900 1920 1940 1960 1980 2000 2020 the 1960s has been hotter than the previ- ous one. On the current path, it is probable Source: NASA GISS, NOAA NCEI, ESRL. https://medialibrary.climatecentral.org/ that within the next 20 years global warming resources/national-and-global-emissions-sources-2020. will surpass 1.5°C while heading toward 2°C possibly by mid-century. Cumulative emis- sions already in the atmosphere will drive ronmental degradation, but the impact will temperature increases in the next two de- vary—some regions will even see some mar- cades even if emissions were to reach net zero ginal bene昀椀ts in the form of longer growing immediately, according to the US National seasons. In general, developing countries will Climate Assessment. su昀昀er more as they lack the capacity to adapt to climate change and on average are more Physical E昀昀ects highly exposed to its e昀昀ects. The physical e昀昀ects of a changing climate are likely to gradually intensify during the next two Melting Arctic and Sea Level Rise. Tempera- decades compared to the catastrophic impacts tures are warming at three times the global modeled for the latter half of the century, average in the Arctic largely as a result of feed- should temperature rise continue unabated. back loops from melting ice and snow cover. No country or region will be immune from the This has caused mass loss from ice sheets and physical e昀昀ects of climate change and envi- glaciers as well as reductions in sea ice extent 32 GLOBAL TRENDS 2040
 GlobalTrends 2040 Page 39 Page 41