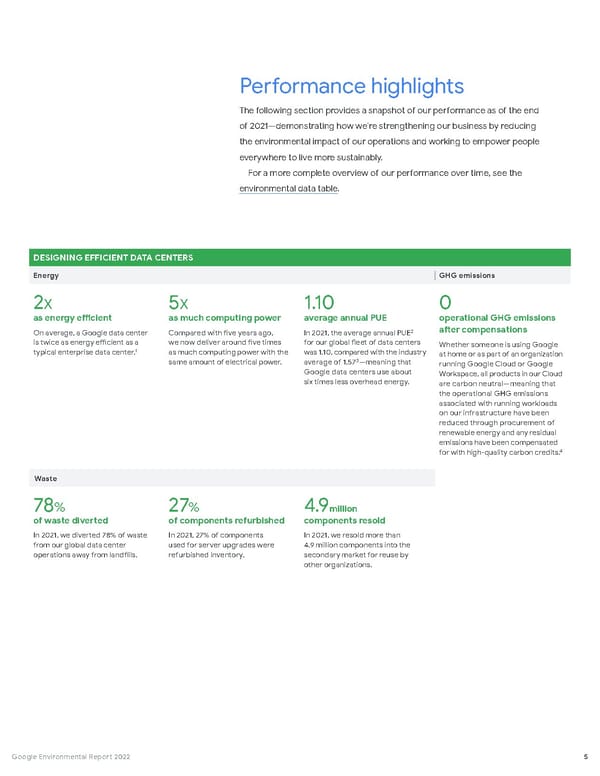
Performance highlights The following section provides a snapshot of our performance as of the end of 2021—demonstrating how we’re strengthening our business by reducing the environmental impact of our operations and working to empower people everywhere to live more sustainably. For a more complete overview of our performance over time, see the environmental data table . DESIGNING EFFICIENT DATA CENTERS Energy GHG emissions 2 X as energy efficient On average, a Google data center is twice as energy efficient as a typical enterprise data center. 1 5 X as much computing power Compared with five years ago, we now deliver around five times as much computing power with the same amount of electrical power. 1.10 average annual PUE In 2021, the average annual PUE 2 for our global fleet of data centers was 1.10, compared with the industry average of 1.57 3 —meaning that Google data centers use about six times less overhead energy. 0 operational GHG emissions after compensations Whether someone is using Google at home or as part of an organization running Google Cloud or Google Workspace, all products in our Cloud are carbon neutral—meaning that the operational GHG emissions associated with running workloads on our infrastructure have been reduced through procurement of renewable energy and any residual emissions have been compensated for with high-quality carbon credits. 4 Waste 78 % of waste diverted In 2021, we diverted 78% of waste from our global data center operations away from landfills. 27 % of components refurbished In 2021, 27% of components used for server upgrades were refurbished inventory. 4.9 million components resold In 2021, we resold more than 4.9 million components into the secondary market for reuse by other organizations. 5 Google Environmental Report 2022
 Google Environmental Report Page 5 Page 7