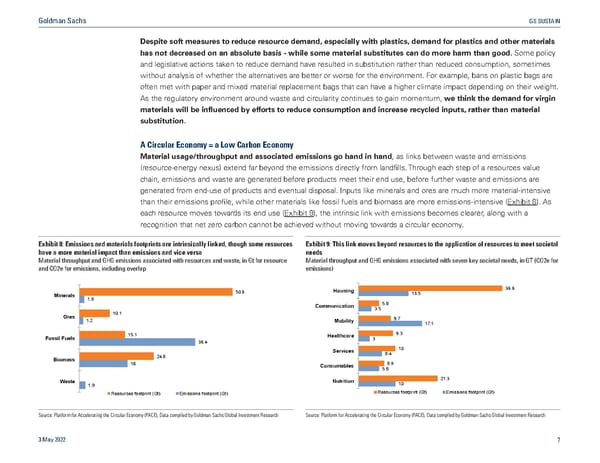
Goldman Sachs GS SUSTAIN Despite soft measures to reduce resource demand, especially with plastics, demand for plastics and other materials has not decreased on an absolute basis - while some material substitutes can do more harm than good. Some policy and legislative actions taken to reduce demand have resulted in substitution rather than reduced consumption, sometimes without analysis of whether the alternatives are better or worse for the environment. For example, bans on plastic bags are often met with paper and mixed material replacement bags that can have a higher climate impact depending on their weight. As the regulatory environment around waste and circularity continues to gain momentum, we think the demand for virgin materials will be influenced by efforts to reduce consumption and increase recycled inputs, rather than material substitution. A Circular Economy = a Low Carbon Economy Material usage/throughput and associated emissions go hand in hand, as links between waste and emissions (resource-energy nexus) extend far beyond the emissions directly from landfills. Through each step of a resources value chain, emissions and waste are generated before products meet their end use, before further waste and emissions are generated from end-use of products and eventual disposal. Inputs like minerals and ores are much more material-intensive than their emissions profile, while other materials like fossil fuels and biomass are more emissions-intensive (Exhibit 8). As each resource moves towards its end use (Exhibit 9), the intrinsic link with emissions becomes clearer, along with a recognition that net zero carbon cannot be achieved without moving towards a circular economy. Exhibit 8: Emissions and materials footprints are intrinsically linked, though some resources Exhibit 9: This link moves beyond resources to the application of resources to meet societal have a more material impact than emissions and vice versa needs Material throughput and GHG emissions associated with resources and waste, in Gt for resource Material throughput and GHG emissions associated with seven key societal needs, in GT (CO2e for and CO2e for emissions, including overlap emissions) 50.8 Housing 38.8 Minerals 13.5 1.6 5.6 Communication 3.5 Ores 10.1 1.2 Mobility 8.7 17.1 Fossil Fuels 15.1 Healthcare 9.3 38.4 3 Services 10 24.6 6.4 Biomass 16 6.9 Consumables 5.6 Waste Nutrition 21.3 1.9 10 Resources footprint (Gt) Emissions footprint (Gt) Resources footprint (Gt) Emissions footprint (Gt) Source: Platform for Accelerating the Circular Economy (PACE), Data compiled by Goldman Sachs Global Investment Research Source: Platform for Accelerating the Circular Economy (PACE), Data compiled by Goldman Sachs Global Investment Research 3 May 2022 7
 GS SUSTAIN: Circular Economy Report Page 7 Page 9