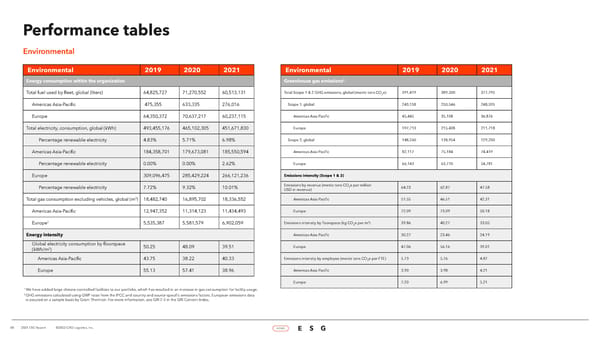
Performance tables Environmental Environmental 2019 2020 2021 Environmental 2019 2020 2021 2 Energy consumption within the organization Greenhouse gas emissions Total fuel used by fleet, global (liters) 64,825,727 71,270,552 60,513,131 Total Scope 1 & 2 GHG emissions, global (metric tons CO e) 391,419 389,500 377,795 2 Americas Asia-Pacific 475,355 633,335 276,016 Scope 1, global 243,158 250,546 248,595 Europe 64,350,372 70,637,217 60,237,115 Americas Asia-Pacific 45,445 35,108 36,876 Total electricity, consumption, global (kWh) 493,455,176 465,102,305 451,671,830 Europe 197,713 215,438 211,718 Percentage renewable electricity 4.83% 5.71% 6.98% Scope 2, global 148,260 138,954 129,200 Americas Asia-Pacific 184,358,701 179,673,081 185,550,594 Americas Asia-Pacific 82,117 75,184 74,419 Percentage renewable electricity 0.00% 0.00% 2.62% Europe 66,143 63,770 54,781 Europe 309,096,475 285,429,224 266,121,236 Emissions intensity (Scope 1 & 2) Emissions by revenue (metric tons CO e per million Percentage renewable electricity 7.72% 9.32% 10.01% USD in revenue) 2 64.23 62.87 47.58 3 Americas Asia-Pacific 51.55 46.51 42.31 Total gas consumption excluding vehicles, global (m ) 18,482,740 16,895,702 18,336,552 Americas Asia-Pacific 12,947,352 11,314,123 11,434,493 Europe 72.09 73.09 50.18 1 2 Europe 5,535,387 5,581,579 6,902,059 Emissions intensity by floorspace (kg CO e per m ) 39.86 40.27 33.05 2 Energy intensity Americas Asia-Pacific 30.27 23.46 24.19 Global electricity consumption by floorspace 50.25 48.09 39.51 Europe 47.06 56.16 39.01 2 (kWh/m ) Americas Asia-Pacific 43.75 38.22 40.33 Emissions intensity by employee (metric tons CO2e per FTE) 5.73 5.76 4.87 Europe 55.13 57.41 38.96 Americas Asia-Pacific 3.90 3.98 4.21 Europe 7.20 6.99 5.21 1 We have added large climate-controlled facilities to our portfolio, which has resulted in an increase in gas consumption for facility usage. 2 GHG emissions calculated using GWP rates from the IPCC and country and source-specific emissions factors. European emissions data is assured on a sample basis by Grant Thornton. For more information, see GRI 2-5 in the GRI Content Index. 88 | 2021 ESG Report ©2022 GXO Logisitcs, Inc. HOME E S G
 GXO Logistics ESG Report Page 87 Page 89