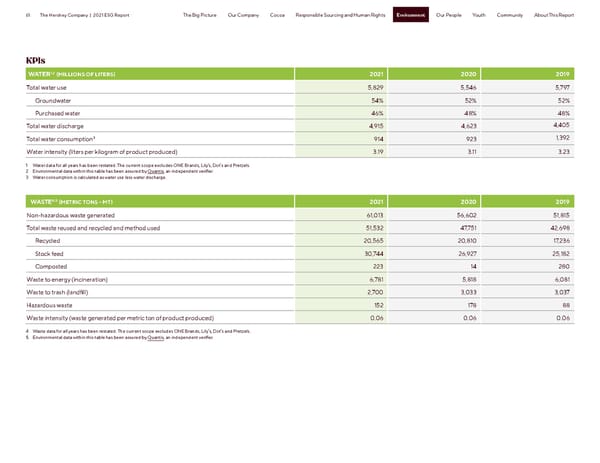
61 The Hershey Company | 2021 ESG Report Environment The Big Picture Our Company Cocoa Responsible Sourcing and Human Rights Environment Our People Youth Community About This Report KPIs WATER1,2 (MILLIONS OF LITERS) 2021 2020 2019 Total water use 5,829 5,546 5,797 Groundwater 54% 52% 52% Purchased water 46% 48% 48% Total water discharge 4,915 4,623 4,405 3 914 923 1,392 Total water consumption Water intensity (liters per kilogram of product produced) 3.19 3.11 3.23 1 Water data for all years has been restated. The current scope excludes ONE Brands, Lily’s, Dot’s and Pretzels. 2 Environmental data within this table has been assured by Quantis, an independent verifier. 3 Water consumption is calculated as water use less water discharge. 4,5 WASTE (METRIC TONS – MT) 2021 2020 2019 Non-hazardous waste generated 61,013 56,602 51,815 Total waste reused and recycled and method used 51,532 47,751 42,698 Recycled 20,565 20,810 17,236 Stock feed 30,744 26,927 25,182 Composted 223 14 280 Waste to energy (incineration) 6,781 5,818 6,081 Waste to trash (landfill) 2,700 3,033 3,037 Hazardous waste 152 178 88 Waste intensity (waste generated per metric ton of product produced) 0.06 0.06 0.06 4 Waste data for all years has been restated. The current scope excludes ONE Brands, Lily’s, Dot’s and Pretzels. 5 Environmental data within this table has been assured by Quantis, an independent verifier.
 Hershey ESG Report Page 60 Page 62