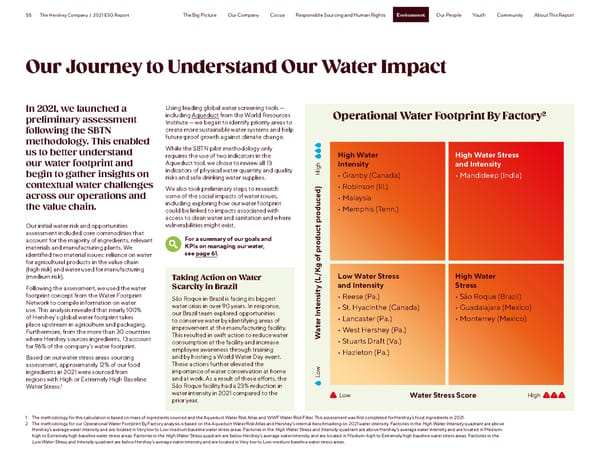
55 The Hershey Company | 2021 ESG Report Environment The Big Picture Our Company Cocoa Responsible Sourcing and Human Rights Environment Our People Youth Community About This Report Our Journey to Understand Our Water Impact In 2021, we launched a Using leading global water screening tools — preliminary assessment including Aqueduct from the World Resources Operational Water Footprint By Factory2 Institute — we began to identify priority areas to following the SBTN create more sustainable water systems and help methodology. This enabled future-proof growth against climate change. us to better understand While the SBTN pilot methodology only requires the use of two indicators in the High Water High Water Stress our water footprint and Aqueduct tool, we chose to review all 13 Intensity and Intensity begin to gather insights on indicators of physical water quantity and quality High • Granby (Canada) • Mandideep (India) risks and safe drinking water supplies. contextual water challenges We also took preliminary steps to research • Robinson (Ill.) across our operations and some of the social impacts of water issues, • Malaysia the value chain. including exploring how our water footprint • Memphis (Tenn.) could be linked to impacts associated with access to clean water and sanitation and where Our initial water risk and opportunities vulnerabilities might exist. assessment included core commodities that For a summary of our goals and account for the majority of ingredients, relevant KPIs on managing our water, materials and manufacturing plants. We see page 61. identified two material issues: reliance on water for agricultural products in the value chain g of product produced) (high risk) and water used for manufacturing (medium risk). Taking Action on Water Low Water Stress High Water Following the assessment, we used the water Scarcity in Brazil and Intensity Stress footprint concept from the Water Footprint São Roque in Brazil is facing its biggest • Reese (Pa.) • São Roque (Brazil) Network to compile information on water water crisis in over 90 years. In response, ensity (L/K• St. Hyacinthe (Canada) • Guadalajara (Mexico) use. This analysis revealed that nearly 100% our Brazil team explored opportunities of Hershey’s global water footprint takes to conserve water by identifying areas of er Int • Lancaster (Pa.) • Monterrey (Mexico) place upstream in agriculture and packaging. improvement at the manufacturing facility. at • West Hershey (Pa.) Furthermore, from the more than 30 countries This resulted in swift action to reduce water W where Hershey sources ingredients, 13 account consumption at the facility and increase • Stuarts Draft (Va.) for 96% of the company’s water footprint. employee awareness through training Based on our water stress areas sourcing and by hosting a World Water Day event. • Hazleton (Pa.) assessment, approximately 12% of our food These actions further elevated the ingredients in 2021 were sourced from importance of water conservation at home Low regions with High or Extremely High Baseline and at work. As a result of these efforts, the 1 São Roque facility had a 23% reduction in Water Stress. water intensity in 2021 compared to the Low Water Stress Score High prior year. 1 The methodology for this calculation is based on mass of ingredients sourced and the Aqueduct Water Risk Atlas and WWF Water Risk Filter. This assessment was first completed for Hershey’s food ingredients in 2021. 2 The methodology for our Operational Water Footprint By Factory analysis is based on the Aqueduct Water Risk Atlas and Hershey’s internal benchmarking on 2021 water intensity. Factories in the High Water Intensity quadrant are above Hershey’s average water intensity and are located in Very low to Low-medium baseline water stress areas. Factories in the High Water Stress and Intensity quadrant are above Hershey’s average water intensity and are located in Medium- high to Extremely high baseline water stress areas. Factories in the High Water Stress quadrant are below Hershey’s average water intensity and are located in Medium-high to Extremely high baseline water stress areas. Factories in the Low Water Stress and Intensity quadrant are below Hershey’s average water intensity and are located in Very low to Low-medium baseline water stress areas.
 Hershey ESG Report Page 54 Page 56