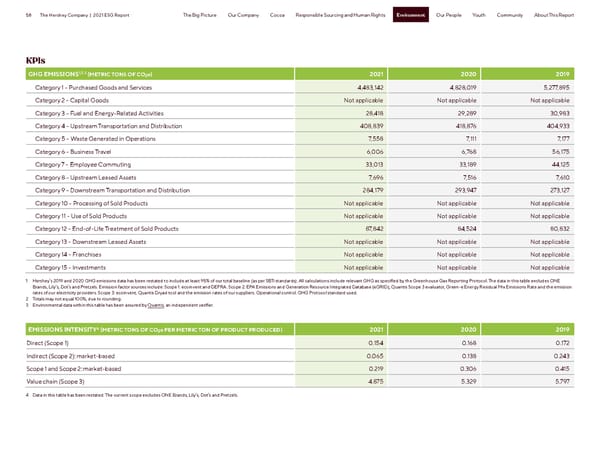
58 The Hershey Company | 2021 ESG Report Environment The Big Picture Our Company Cocoa Responsible Sourcing and Human Rights Environment Our People Youth Community About This Report KPIs 1,2,3 GHG EMISSIONS (METRIC TONS OF CO e) 2021 2020 2019 2 Category 1 – Purchased Goods and Services 4,483,142 4,828,019 5,277,895 Category 2 – Capital Goods Not applicable Not applicable Not applicable Category 3 – Fuel and Energy-Related Activities 28,418 29,289 30,983 Category 4 – Upstream Transportation and Distribution 408,839 418,876 404,933 Category 5 – Waste Generated in Operations 7,558 7,111 7,177 Category 6 – Business Travel 6,006 6,768 56,175 Category 7 – Employee Commuting 33,013 33,189 44,125 Category 8 – Upstream Leased Assets 7,696 7,516 7,610 Category 9 – Downstream Transportation and Distribution 284,179 293,947 273,127 Category 10 – Processing of Sold Products Not applicable Not applicable Not applicable Category 11 – Use of Sold Products Not applicable Not applicable Not applicable Category 12 – End-of-Life Treatment of Sold Products 87,842 84,524 80,832 Category 13 – Downstream Leased Assets Not applicable Not applicable Not applicable Category 14 – Franchises Not applicable Not applicable Not applicable Category 15 – Investments Not applicable Not applicable Not applicable 1 Hershey’s 2019 and 2020 GHG emissions data has been restated to include at least 95% of our total baseline (as per SBTi standards). All calculations include relevant GHG as specified by the Greenhouse Gas Reporting Protocol. The data in this table excludes ONE Brands, Lily’s, Dot’s and Pretzels. Emission factor sources include: Scope 1: ecoinvent and DEFRA. Scope 2: EPA Emissions and Generation Resource Integrated Database (eGRID), Quantis Scope 3 evaluator, Green-e Energy Residual Mix Emissions Rate and the emission rates of our electricity providers. Scope 3: ecoinvent, Quantis Dryad tool and the emission rates of our suppliers. Operational control. GHG Protocol standard used. 2 Totals may not equal 100%, due to rounding. 3 Environmental data within this table has been assured by Quantis, an independent verifier. 4 EMISSIONS INTENSITY (METRIC TONS OF CO e PER METRIC TON OF PRODUCT PRODUCED) 2021 2020 2019 2 0.154 0.168 0.172 Direct (Scope 1) Indirect (Scope 2): market-based 0.065 0.138 0.243 Scope 1 and Scope 2: market-based 0.219 0.306 0.415 Value chain (Scope 3) 4.875 5.329 5.797 4 Data in this table has been restated. The current scope excludes ONE Brands, Lily’s, Dot’s and Pretzels.
 Hershey ESG Report Page 57 Page 59