

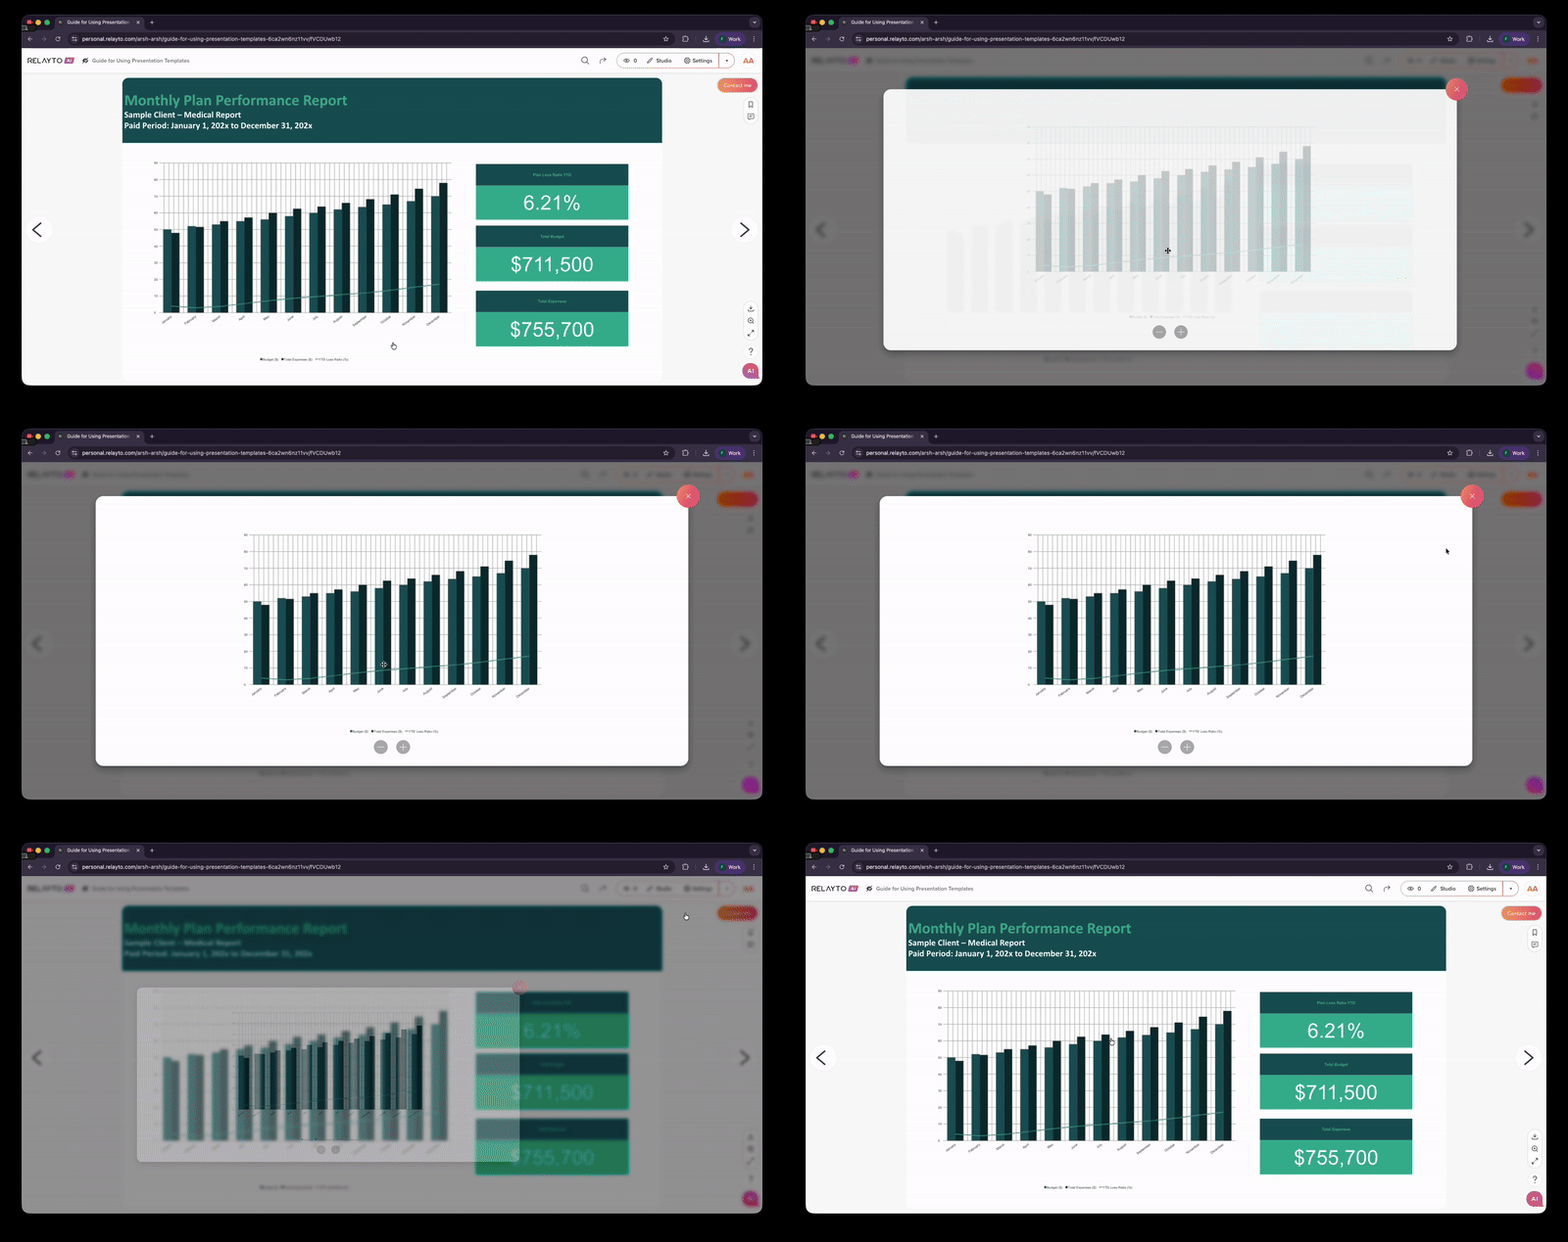
If your visuals—like charts or graphs—appear too small within your RELAYTO experience, you can easily resize or make them interactive for better visibility. Follow these steps:
Step 1
Open your RELAYTO experience.
Click “Studio” in the top-right corner to activate page editing mode.
.png)
Step 2
Click the “Add Interactivity” button to view the available options for enhancing your experience.
.png)
Step 3
Click the “Rectangle” button under the Shapes menu to upload a rectangle.
.png)
Step 4
After adding the rectangle, make sure it fully covers the graph or chart you want to make zoomable.
.png)
Step 5
Click the “Add Action on Click” button in the top-right corner above the image.
.png)
Step 6
From the list of actions, select “Open Image.”
When the “Select Files to Upload” window appears, upload the large, high-resolution version of your chart or graph.
.png)
Step 7
Go to Styles, select Background, and set Opacity to 0.
.png)
That’s it! Now your audience can click to zoom in on charts or graphs for a closer look. Bonus: every click on the chart will also be tracked in your analytics!
Related Articles:
✏️ How to Change Your Content's Basic Information
Thank you for joining us in this tutorial! If you have any questions or need help, feel free to email us at support@relayto.com or book a call here.