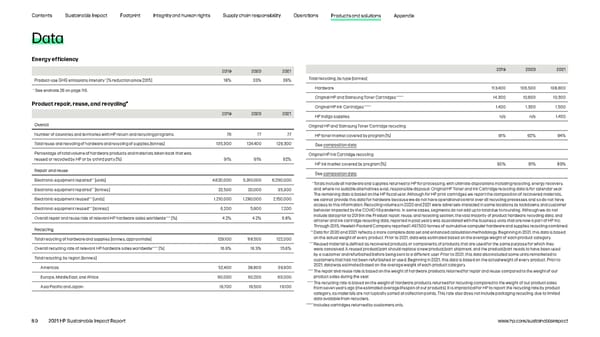
Contents Sustainable Impact Footprint Integrity and human rights Supply chain responsibility Operations Products and solutions Appendix Data Energy efficiency 2019 2020 2021 2019 2020 2021 Product-use GHG emissions intensity* Total recycling, by type [tonnes] [% reduction since 2015] 18% 33% 39% * Hardware 113,400 106,500 108,800 See endnote 26 on page 116. Original HP and Samsung Toner Cartridges****** 14,300 10,600 10,300 Product repair, reuse, and recycling* Original HP Ink Cartridges****** 1,400 1,300 1,500 2019 2020 2021 HP Indigo supplies n/a n/a 1,400 Overall Original HP and Samsung Toner Cartridge recycling Number of countries and territories with HP return and recycling programs 76 77 77 HP toner market covered by program [%] 91% 92% 94% Total reuse and recycling of hardware and recycling of supplies [tonnes] 135,300 124,400 129,300 See composition data. Percentage of total volume of hardware products and materials taken back that was Original HP Ink Cartridge recycling reused or recycled by HP or by a third party [%] 91% 91% 92% HP ink market covered by program [%] 90% 91% 89% Repair and reuse See composition data. ** Electronic equipment repaired [units] 4,620,000 5,310,000 6,290,000 * Totals include all hardware and supplies returned to HP for processing, with ultimate dispositions including recycling, energy recovery, ** and, where no suitable alternatives exist, responsible disposal. Original HP Toner and Ink Cartridge recycling data is for calendar year. Electronic equipment repaired [tonnes] 22,500 20,000 35,300 The remaining data is based on the HP fiscal year. Although for HP print cartridges we report the composition of recovered materials, *** Electronic equipment reused [units] 1,210,000 1,280,000 2,150,000 we cannot provide this data for hardware because we do not have operational control over all recycling processes and so do not have access to this information. Recycling volumes in 2020 and 2021 were adversely impacted in some locations by lockdowns and customer *** Electronic equipment reused [tonnes] 6,200 5,900 7,200 behavior impacted by the COVID-19 pandemic. In some cases, segments do not add up to total due to rounding. Although we do not **** include data prior to 2019 in the Product repair, reuse, and recycling section, the vast majority of product hardware recycling data, and Overall repair and reuse rate of relevant HP hardware sales worldwide [%] 4.2% 4.2% 6.8% all toner and ink cartridge recycling data, reported in past years was associated with the business units that are now a part of HP Inc. Recycling Through 2015, Hewlett-Packard Company reported 1,497,500 tonnes of cumulative computer hardware and supplies recycling combined. ** Data for 2020 and 2021 reflects a more complete data set and enhanced calculation methodology. Beginning in 2021, this data is based Total recycling of hardware and supplies [tonnes, approximate] 129,100 118,500 122,000 on the actual weight of every product. Prior to 2021, data was estimated based on the average weight of each product category. *** Reused material is defined as recovered products or components of products that are used for the same purpose for which they ***** Overall recycling rate of relevant HP hardware sales worldwide [%] 16.9% 16.3% 15.6% were conceived. A reused product/part should replace a new product/part shipment, and the product/part needs to have been used Total recycling, by region [tonnes] by a customer and refurbished before being sent to a different user. Prior to 2021, this data also included some units remarketed to customers that had not been refurbished or used. Beginning in 2021, this data is based on the actual weight of every product. Prior to Americas 52,400 38,800 39,900 2021, data was estimated based on the average weight of each product category. **** The repair and reuse rate is based on the weight of hardware products returned for repair and reuse compared to the weight of our Europe, Middle East, and Africa 60,000 60,200 63,000 product sales during the year. ***** The recycling rate is based on the weight of hardware products returned for recycling compared to the weight of our product sales Asia Pacific and Japan 16,700 19,500 19,100 from seven years ago (the estimated average lifespan of our products). It is impractical for HP to report the recycling rate by product category, as materials are not typically sorted at collection points. This rate also does not include packaging recycling, due to limited data available from recyclers. ****** Includes cartridges returned by customers only. 89 2021 HP Sustainable Impact Report www.hp.com/sustainableimpact
 HP Sustainable Impact Report Page 88 Page 90