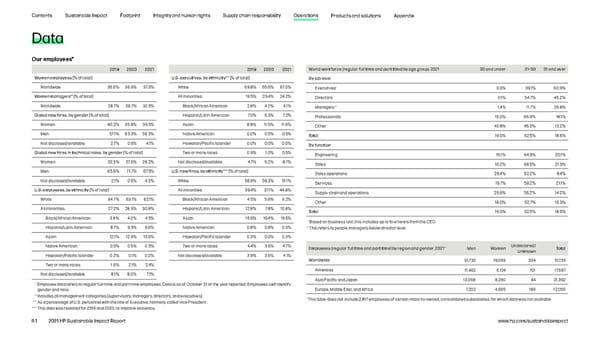
Contents Sustainable Impact Footprint Integrity and human rights Supply chain responsibility Operations Products and solutions Appendix Data Our employees* 2019 2020 2021 2019 2020 2021 World workforce (regular full time and part time) by age group, 2021 30 and under 31–50 51 and over *** Women employees [% of total] U.S. executives, by ethnicity [% of total] By job level Worldwide 36.6% 36.9% 37.3% White 69.8% 65.6% 67.0% Executives* 0.0% 39.1% 60.9% ** Women managers [% of total] All minorities 19.5% 23.4% 24.2% Directors 0.1% 54.7% 45.2% Worldwide 28.7% 29.7% 32.5% Black/African American 2.8% 4.2% 4.1% Managers** 1.4% 71.7% 26.8% Global new hires, by gender [% of total] Hispanic/Latin American 7.0% 6.3% 7.2% Professionals 15.0% 66.9% 18.1% Women 40.2% 35.8% 39.5% Asian 8.8% 11.5% 11.9% Other 40.8% 46.0% 13.2% Men 57.1% 63.3% 56.5% Native American 0.0% 0.5% 0.5% Total 19.0% 62.5% 18.6% Not disclosed/available 2.7% 0.9% 4.1% Hawaiian/Pacific Islander 0.0% 0.0% 0.0% By function Global new hires in technical roles, by gender [% of total] Two or more races 0.9% 1.0% 0.5% Engineering 15.1% 64.9% 20.1% Women 32.3% 27.6% 28.2% Not disclosed/available 4.7% 5.2% 8.7% Sales 10.2% 68.5% 21.3% **** Men 65.6% 71.7% 67.5% U.S. new hires, by ethnicity [% of total] Sales operations 29.4% 62.2% 8.4% Not disclosed/available 2.1% 0.6% 4.3% White 56.6% 59.3% 51.1% Services 19.7% 59.2% 21.1% U.S. employees, by ethnicity [% of total] All minorities 39.4% 37.1% 44.8% Supply chain and operations 29.6% 56.2% 14.2% White 64.7% 63.1% 62.1% Black/African American 4.5% 5.6% 9.2% Other 18.0% 62.7% 19.3% All minorities 27.2% 28.9% 30.8% Hispanic/Latin American 12.8% 7.8% 10.8% Total 19.0% 62.5% 18.6% Black/African American 3.8% 4.0% 4.5% Asian 16.6% 19.4% 19.5% * Based on business unit, this includes up to four levels from the CEO. Hispanic/Latin American 8.7% 9.3% 9.6% Native American 0.8% 0.8% 0.3% ** This refers to people managers below director level. Asian 12.1% 12.9% 13.6% Hawaiian/Pacific Islander 0.3% 0.0% 0.3% Native American 0.5% 0.5% 0.5% Two or more races 4.4% 3.6% 4.7% Employees (regular full time and part time) by region and gender, 2021* Men Women Undeclared/ Total Unknown Hawaiian/Pacific Islander 0.2% 0.1% 0.2% Not disclosed/available 3.9% 3.6% 4.1% Worldwide 31,732 19,069 334 51,135 Two or more races 1.9% 2.1% 2.4% Americas 11,462 6,124 101 17,687 Not disclosed/available 8.1% 8.0% 7.1% Asia Pacific and Japan 13,068 8,280 44 21,392 * Employee data refers to regular full-time and part-time employees. Data is as of October 31 of the year reported. Employees self-identify gender and race. Europe, Middle East, and Africa 7,202 4,665 189 12,056 ** Includes all management categories (supervisors, managers, directors, and executives). * This table does not include 2,817 employees of certain majority-owned, consolidated subsidiaries, for which data was not available. *** As a percentage of U.S. personnel with the title of Executive, formerly called Vice President. **** This data was restated for 2019 and 2020, to improve accuracy. 61 2021 HP Sustainable Impact Report www.hp.com/sustainableimpact
 HP Sustainable Impact Report Page 60 Page 62