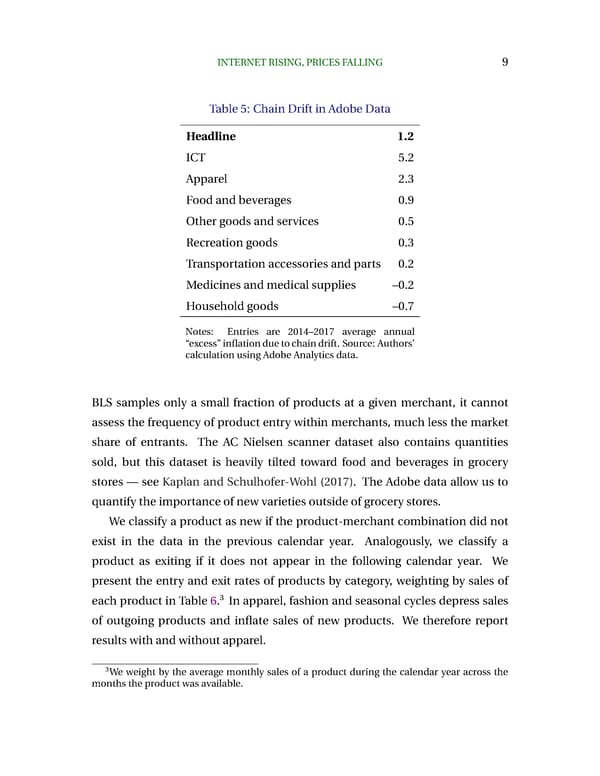
INTERNETRISING,PRICESFALLING 9 Table5: ChainDriftinAdobeData Headline 1.2 ICT 5.2 Apparel 2.3 Foodandbeverages 0.9 Othergoodsandservices 0.5 Recreationgoods 0.3 Transportationaccessoriesandparts 0.2 Medicinesandmedicalsupplies –0.2 Householdgoods –0.7 Notes: Entries are 2014–2017 average annual “excess”inflationduetochaindrift. Source: Authors’ calculationusingAdobeAnalyticsdata. BLS samples only a small fraction of products at a given merchant, it cannot assess the frequency of product entry within merchants, much less the market share of entrants. The AC Nielsen scanner dataset also contains quantities sold, but this dataset is heavily tilted toward food and beverages in grocery stores — see Kaplan and Schulhofer-Wohl (2017). The Adobe data allow us to quantifytheimportanceofnewvarietiesoutsideofgrocerystores. Weclassify a product as new if the product-merchant combination did not exist in the data in the previous calendar year. Analogously, we classify a product as exiting if it does not appear in the following calendar year. We present the entry and exit rates of products by category, weighting by sales of 3 eachproductinTable6. Inapparel,fashionandseasonalcyclesdepresssales of outgoing products and inflate sales of new products. We therefore report results with and withoutapparel. 3We weight by the average monthly sales of a product during the calendar year across the monthstheproductwasavailable.
 Internet Rising, Prices Falling Page 8 Page 10