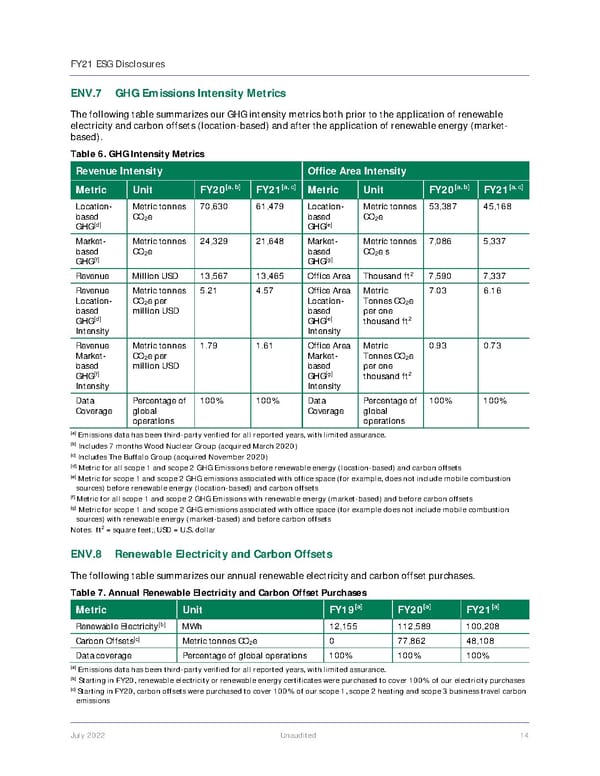
FY21 ESG Disclosures July 2022 Unaudited 14 ENV.7 GHG Emissions Intensity Metrics The following table summarizes our GHG intensity metrics both prior to the application of renewable electricity and carbon offsets (location-based) and after the application of renewable energy (market- based). Table 6. GHG Intensity Metrics Revenue Intensity Office Area Intensity Metric Unit FY20 [a, b] FY21 [a, c] Metric Unit FY20 [a, b] FY21 [a, c] Location- based GHG [d] Metric tonnes CO 2 e 70,630 61,479 Location- based GHG [e] Metric tonnes CO 2 e 53,387 45,168 Market- based GHG [f] Metric tonnes CO 2 e 24,329 21,648 Market- based GHG [g] Metric tonnes CO 2 e s 7,086 5,337 Revenue Million USD 13,567 13,465 Office Area Thousand ft 2 7,590 7,337 Revenue Location- based GHG [d] Intensity Metric tonnes CO 2 e per million USD 5.21 4.57 Office Area Location- based GHG [e] Intensity Metric Tonnes CO 2 e per one thousand ft 2 7.03 6.16 Revenue Market- based GHG [f] Intensity Metric tonnes CO 2 e per million USD 1.79 1.61 Office Area Market- based GHG [g] Intensity Metric Tonnes CO 2 e per one thousand ft 2 0.93 0.73 Data Coverage Percentage of global operations 100% 100% Data Coverage Percentage of global operations 100% 100% [a] Emissions data has been third-party verified for all reported years, with limited assurance. [b] Includes 7 months Wood Nuclear Group (acquired March 2020) [c] Includes The Buffalo Group (acquired November 2020) [d] Metric for all scope 1 and scope 2 GHG Emissions before renewable energy (location-based) and carbon offsets [e] Metric for scope 1 and scope 2 GHG emissions associated with office space (for example, does not include mobile combustion sources) before renewable energy (location-based) and carbon offsets [f] Metric for all scope 1 and scope 2 GHG Emissions with renewable energy (market-based) and before carbon offsets [g] Metric for scope 1 and scope 2 GHG emissions associated with office space (for example does not include mobile combustion sources) with renewable energy (market-based) and before carbon offsets Notes: ft 2 = square feet;; USD = U.S. dollar ENV.8 Renewable Electricity and Carbon Offsets The following table summarizes our annual renewable electricity and carbon offset purchases. Table 7. Annual Renewable Electricity and Carbon Offset Purchases Metric Unit FY19 [a] FY20 [a] FY21 [a] Renewable Electricity [b] MWh 12,155 112,589 100,208 Carbon Offsets [c] Metric tonnes CO 2 e 0 77,862 48,108 Data coverage Percentage of global operations 100% 100% 100% [a] Emissions data has been third-party verified for all reported years, with limited assurance. [b] Starting in FY20, renewable electricity or renewable energy certificates were purchased to cover 100% of our electricity purchases [c] Starting in FY20, carbon offsets were purchased to cover 100% of our scope 1, scope 2 heating and scope 3 business travel carbon emissions
 Jacobs Engineering Group ESG Disclosures Page 14 Page 16