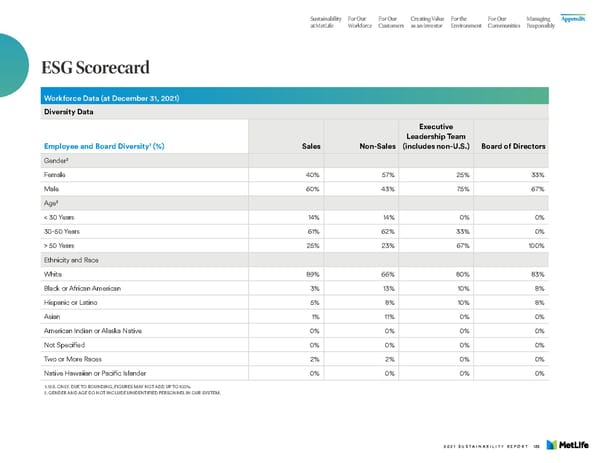
Sustainability For Our For Our Creating Value For the For Our Managing Appendix at MetLife Workforce Customers as an Investor Environment Communities Responsibly ESG Scorecard Workforce Data (at December 31, 2021) Diversity Data Executive Leadership Team Employee and Board Diversity1 (%) Sales Non-Sales (includes non-U.S.) Board of Directors 2 Gender Female 40% 57% 25% 33% Male 60% 43% 75% 67% Age2 < 30 Years 14% 14% 0% 0% 30-50 Years 61% 62% 33% 0% > 50 Years 25% 23% 67% 100% Ethnicity and Race White 89% 66% 80% 83% Black or African American 3% 13% 10% 8% Hispanic or Latino 5% 8% 10% 8% Asian 1% 11% 0% 0% American Indian or Alaska Native 0% 0% 0% 0% Not Specified 0% 0% 0% 0% Two or More Races 2% 2% 0% 0% Native Hawaiian or Pacific Islander 0% 0% 0% 0% 1. U .S. ONLY. DUE TO ROUNDING, FIGURES MAY NOT ADD UP TO 100%. 2. GENDER AND AGE DO NOT INCLUDE UNIDENTIFIED PERSONNEL IN OUR SYSTEM. 2021 SUSTAINABILITY REPORT 138
 MetLife Sustainability Report Page 139 Page 141