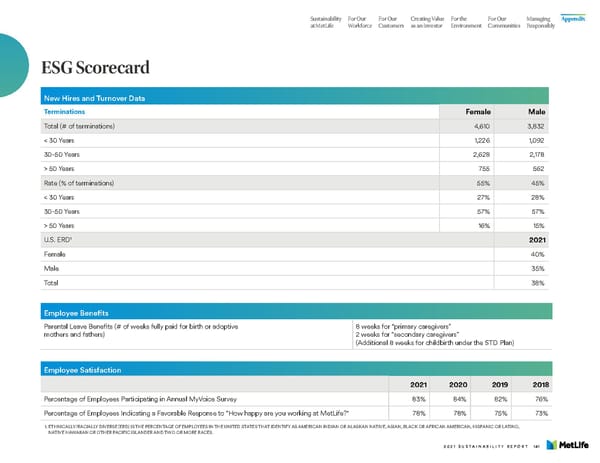
Sustainability For Our For Our Creating Value For the For Our Managing Appendix at MetLife Workforce Customers as an Investor Environment Communities Responsibly ESG Scorecard New Hires and Turnover Data Terminations Female Male Total (# of terminations) 4,610 3,832 < 30 Years 1,226 1,092 30-50 Years 2,628 2,178 > 50 Years 755 562 Rate (% of terminations) 55% 45% < 30 Years 27% 28% 30-50 Years 57% 57% > 50 Years 16% 15% U.S. ERD1 2021 Female 40% Male 35% Total 38% Employee Benefits Parental Leave Benefits (# of weeks fully paid for birth or adoptive 8 weeks for “primary caregivers” mothers and fathers) 2 weeks for “secondary caregivers” (Additional 8 weeks for childbirth under the STD Plan) Employee Satisfaction 2021 2020 2019 2018 Percentage of Employees Participating in Annual MyVoice Survey 83% 84% 82% 76% Percentage of Employees Indicating a Favorable Response to “How happy are you working at MetLife?" 78% 78% 75% 73% 1. ETHNIC ALLY/RACIALLY DIVERSE (ERD) IS THE PERCENTAGE OF EMPLOYEES IN THE UNITED STATES THAT IDENTIFY AS AMERICAN INDIAN OR ALASKAN NATIVE, ASIAN, BLACK OR AFRICAN AMERICAN, HISPANIC OR LATINO, NATIVE HAWAIIAN OR OTHER PACIFIC ISLANDER AND TWO OR MORE RACES. 2021 SUSTAINABILITY REPORT 141
 MetLife Sustainability Report Page 142 Page 144